Visual Studio Code vs Rider for Unity
Visual Studio Code is almost perfect, very very few annoyances. But in this competitive scene of text editor, it is tempting to pay just to eliminate those annoyances from the tool I touch every day.


I switched from Atom to VSCode years ago simply because I like blocky and flat UI, but soon I discovered that VSCode has just the right amount of features yet well tucked away from view. But what leads me to evaluate Rider now?
Visual Studio Code is almost perfect, very very few annoyances. But in this competitive scene of text editor, it is tempting to pay just to eliminate those annoyances from the tool I touch every day. (Of course, after knowing several years passed with no resolution about them.)
Rider is not even famous for these annoyances fix I would like to pay for. It is famous for its "intelligence" as an IDE or deep Unity integration, that I am not really care at the moment. I just want a beefed up text editor like VSCode but without little flaws. Let's see if Rider can fix them. And how to modify Rider so it looks more like VSCode, so I could get both bug fixes and simple looks.
- What better or worse things in Rider compared to VSCode.
- How to make Rider more like VSCode for those who liked VSCode, but just want that one bug fixed or that feature added now without waiting for submitted issue to be resolved in VSCode.
- I will go as far as very little polishes, since fundamentally all modern code editor could do the same job. It's these details that make a difference.
- Rider version evaluated is 2019.3.
Fallback perpetual license
The first thing you may think as soon as you notice that the business model is a subscription based in their website : "I don't want to subscribe to a mere text editor!!" Well text editor is our tool of the trade and is hard to perfect so you may need to reconsider its worth.
Anyways, I would be fine with one-off payment. I was put off by the subscription model because of insecurity of having to pay indefinitely.
Until I see that they offer this. Basically, when you stop your 1 year subscription you simply stop receiving updates and can continue using your version back when you first started. Also you can extend for a few months if you would like to stretch the coverage to get new features that match your use case then you could stop there.
Unlike Adobe for example which they will prevent you from using the tools completely. This is very nice and made me change my mind about purchasing Rider. Yes, it feels more like purchasing this way and I may even continue the subscription because they are generous. More information here.
VSCodeVim vs IdeaVim
I rely on Vim key bindings daily, and VSCodeVim has lingering problems that was unfixed for multiple years :
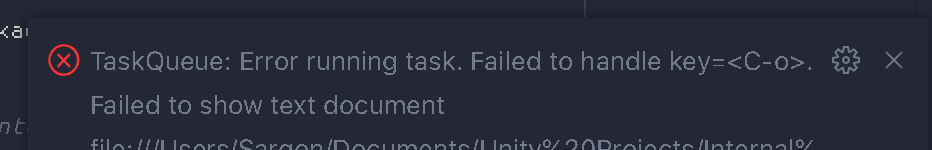
gdto jump to definition usually works fine, but the reverseControl + Ooften return back to wrong place or throw dialog box error.
- The plugin doesn't count code refactor as an undo step, when you do something next to a refactor and undo, you undo that step plus the whole refactor.
- Code snippets with variable transformation doesn't work when this plugin is on.
- Macro recording
qqplayback "too literally" and sometimes missing some movement commands causing my plan to fail. Also it is quite slow, if the command is long then I can see it doing things as I wait for it to complete.
I evaluate IdeaVim for a bit, it seems to not have any of mentioned problem. But instead :
-
==or=i(to format code in IdeaVim doesn't work, while it works in VSCodeVim. gcfor commenting in visual mode is not implemented, but it is in VSCodeVim. I have to resort toCmd+/normal shortcut.
There is always something missing in any Vim emulation!
I understand that I should not feel entitled to have a bug-free VSCodeVim where it is an open source project with tons of open issues on GitHub. If I am not willing to contribute, then I have no right to demand things from them. However it is also true that I don't have time to study how to contribute, and IdeaVim is a company maintained solution that I could spend money on instead of time. I guess this is where money could motivate you and result in a more polished product.
IdeaVim is fast!
Maybe this alone worth the price. As in, in VSCode when you turn off VSCodeVim even simple line movement command is slower than you press down arrow with plugin off. It is apparent in a command that jumps over distance like Shift + ].
It feels like VSCodeVim went through "something" before it could move. Maybe you won't feel it, but I am a music gamer and a game developer. I can tell responsiveness difference. Using real Vim like the one in Terminal or MacVim, the feel of responsiveness is very similar to Rider, but not to VSCodeVim.
(I am not saying Rider is faster than VSCode, that is impossible since Rider is more of an IDE. But if only the IdeaVim part, then it is faster. And it worth noting here that this text editing is the core part of programming experience, not start up time.)
Omnisharp vs ReSharper
Omnisharp works fine most of the time, including project-wide variable rename that's important to my workflow so I can name my variable mindlessly when drafting up quick code.
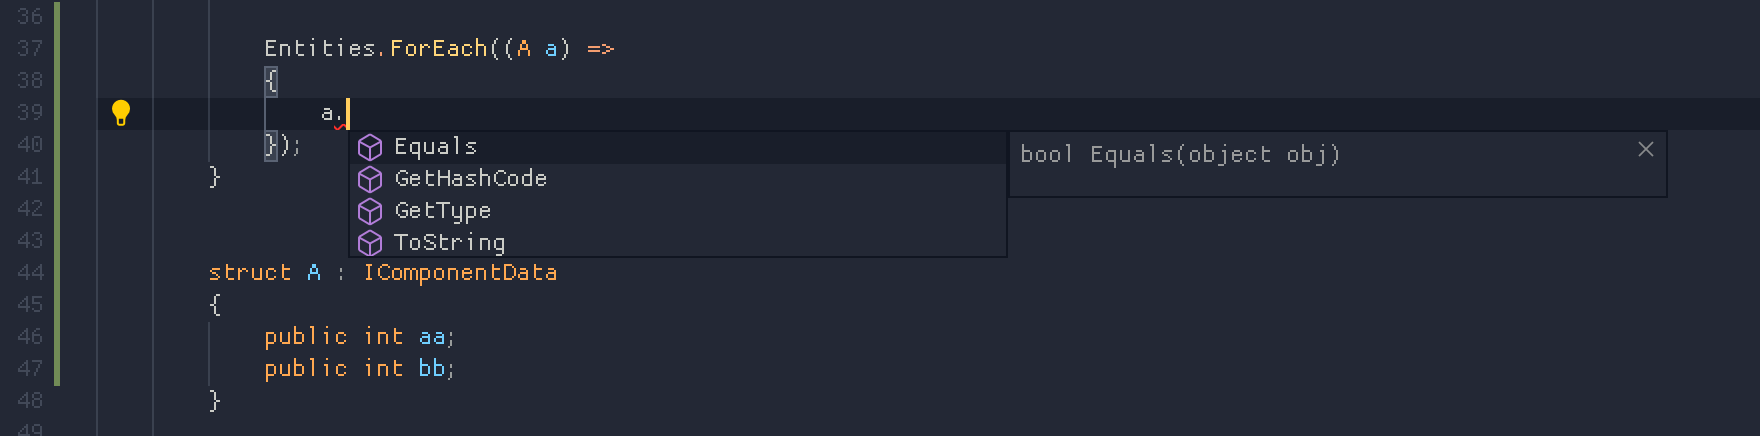
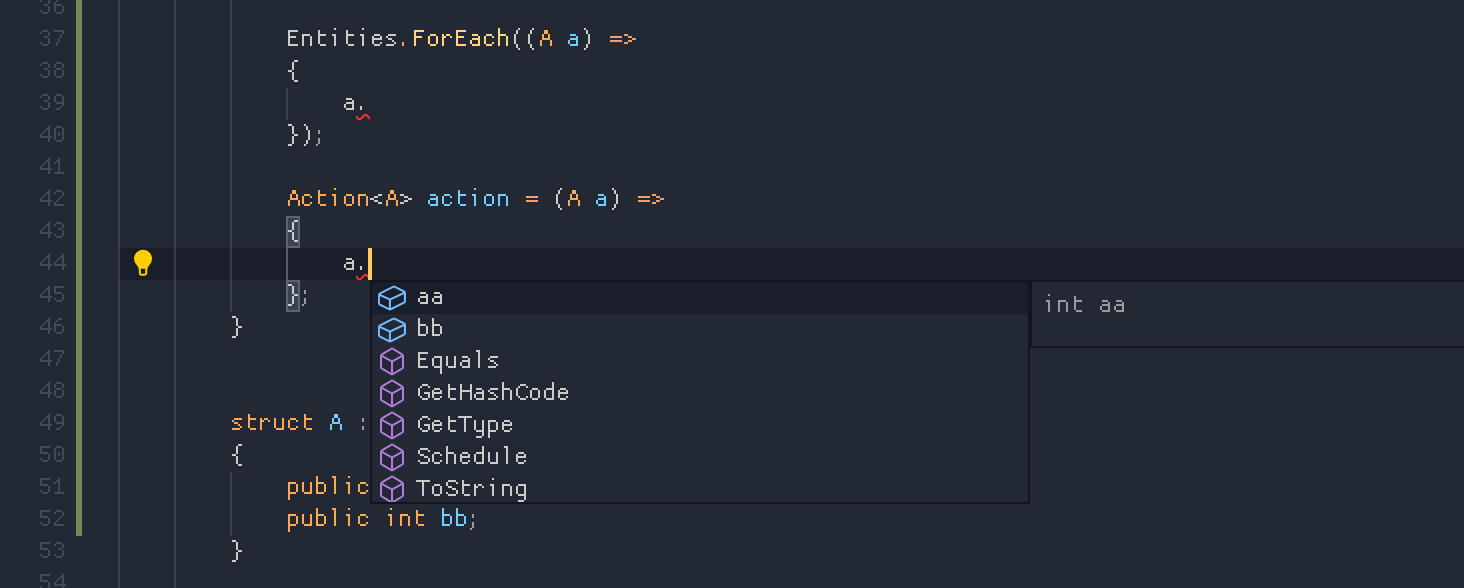
In a very complicated case however it fails. For example, this variable in a lambda-in-a-method doesn't auto complete, where it does in a simpler lambda. This pattern is important in Unity's ECS library.
ReSharper is well, sharper...
Also I should mention ReSharper start up faster than Omnisharp. VSCode has reputation of being very fast, but that's not counting the time until your C# project truly come alive. In Rider, starting up the program itself is quite slow. But it is fully usable soon after. In the end I think total time is about the same.
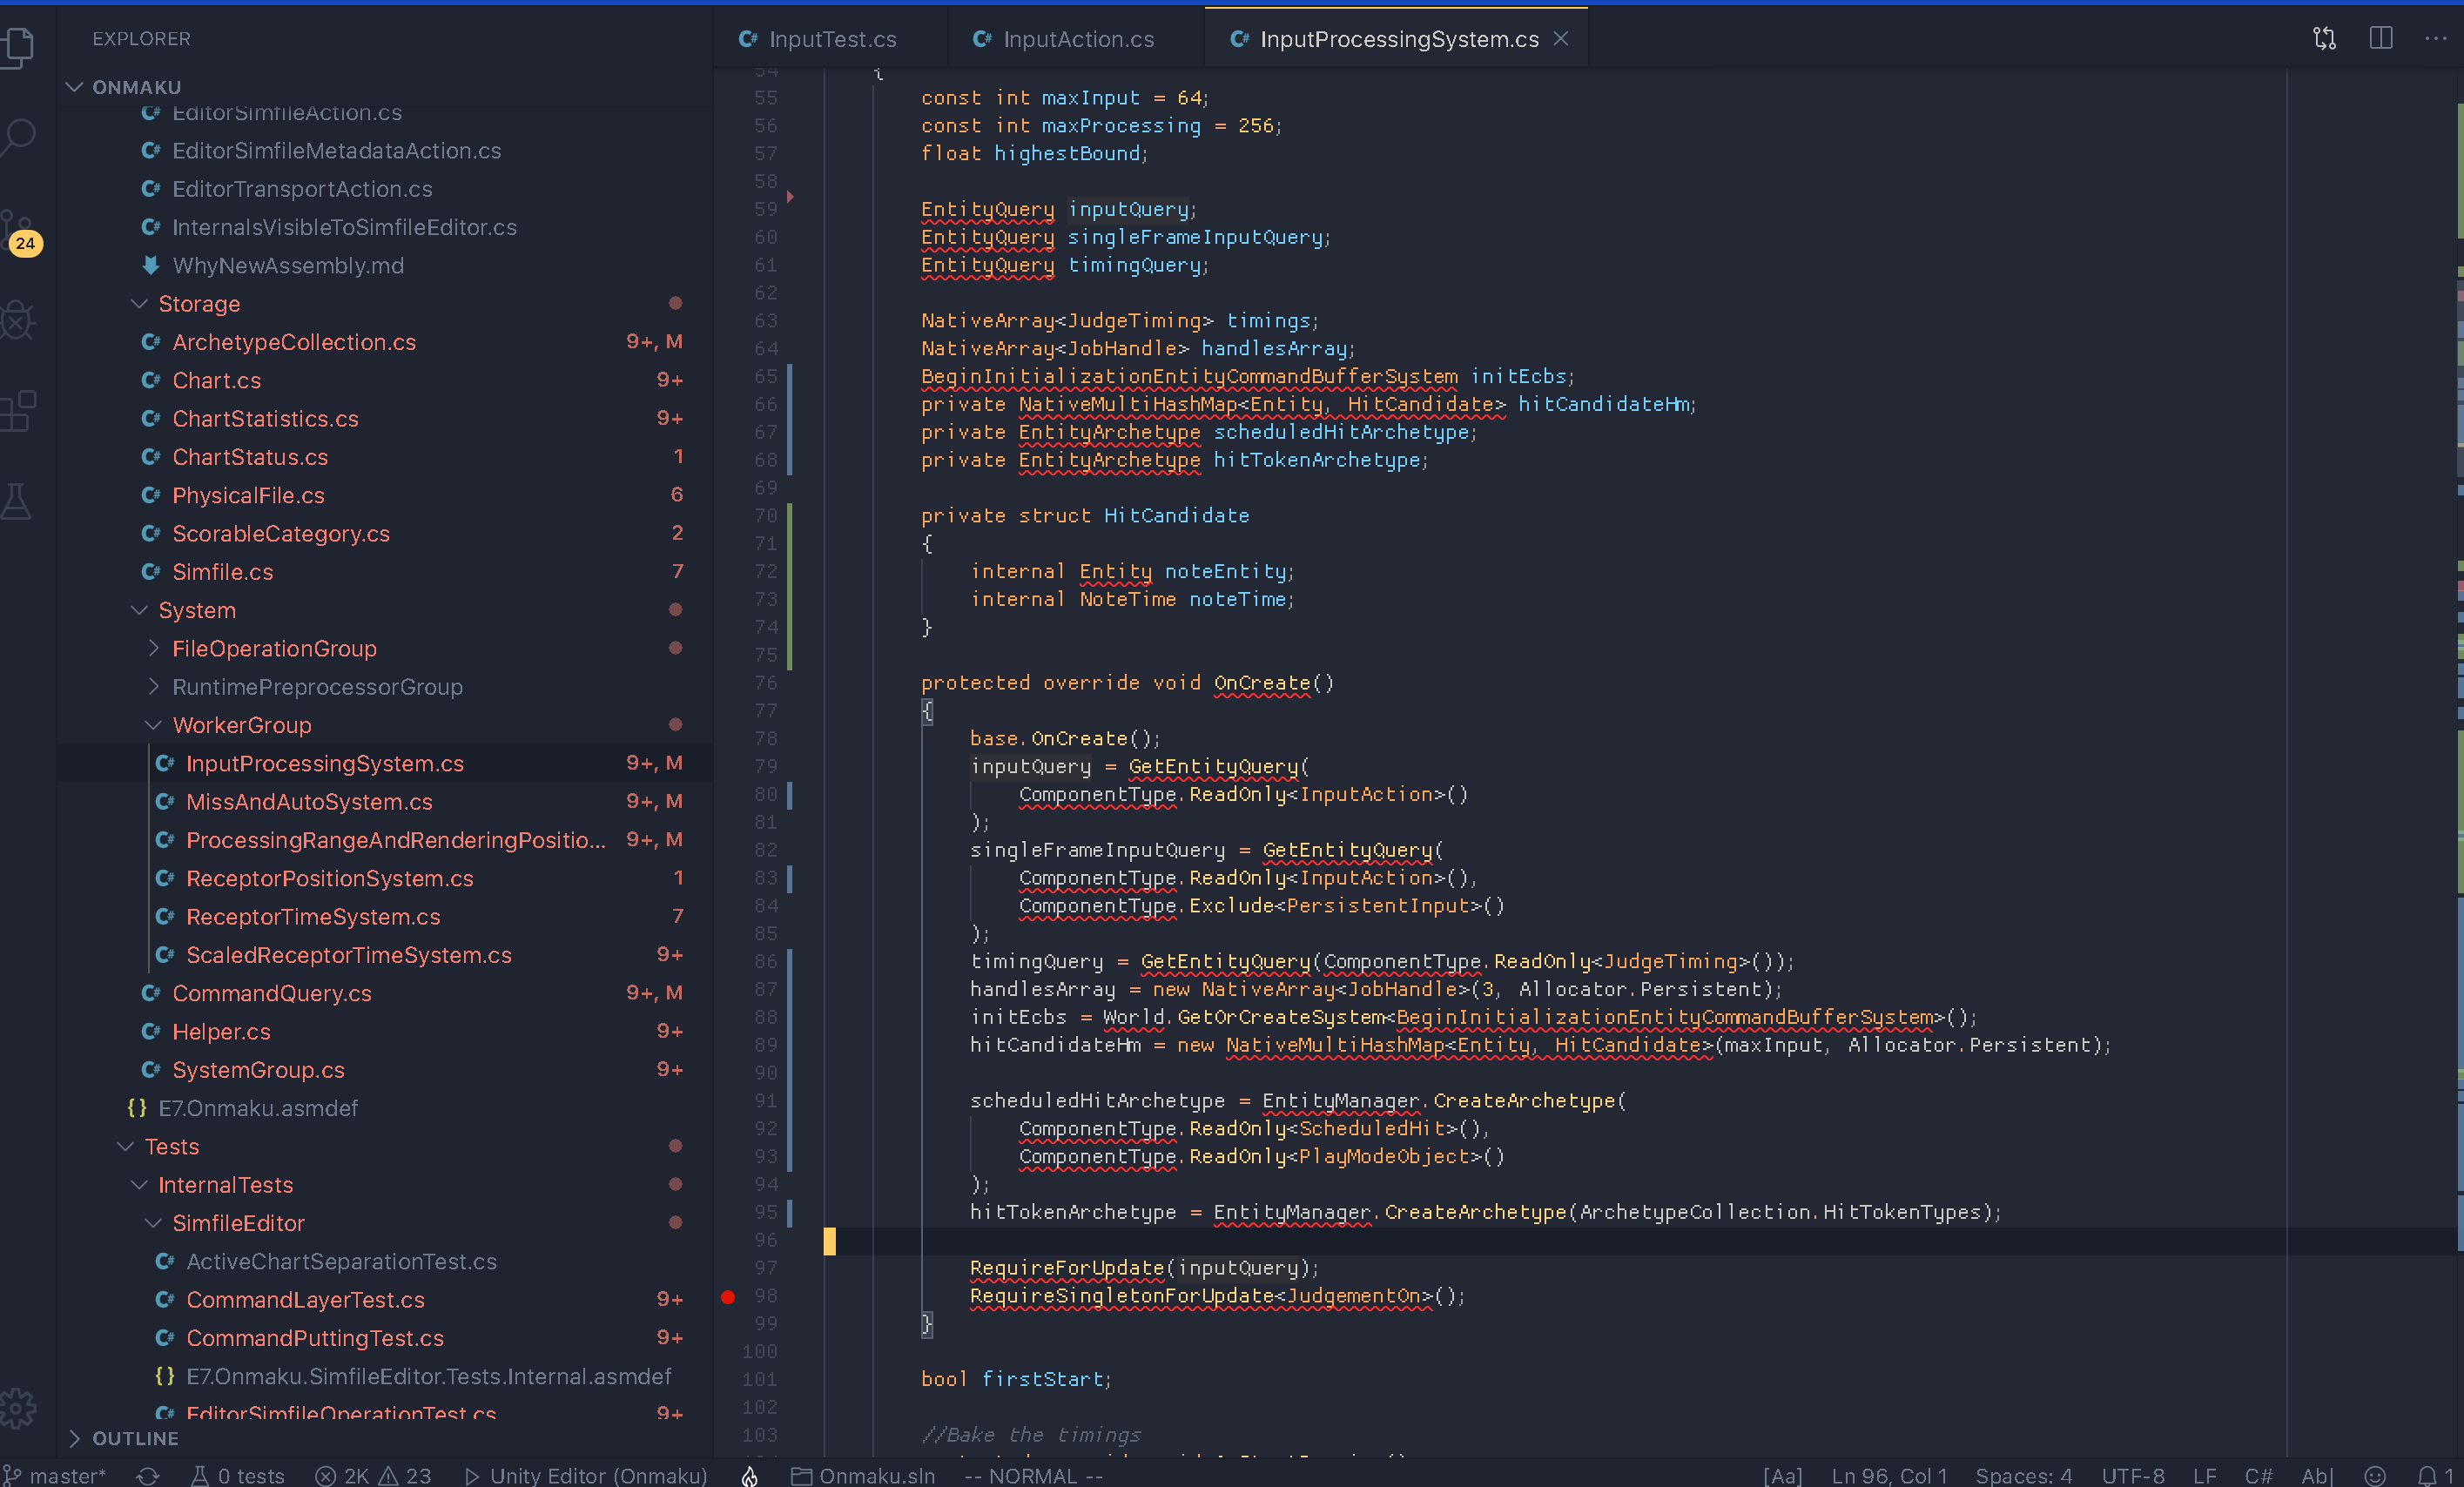
Code completion dialog size
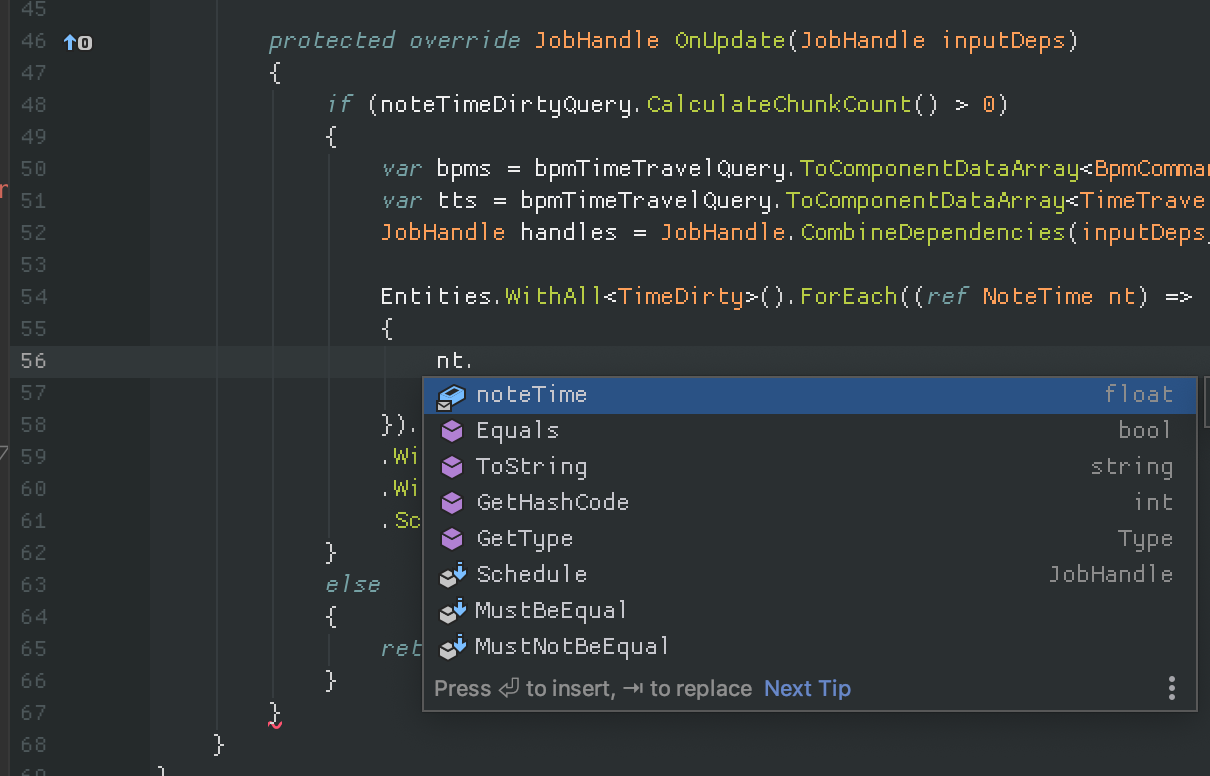
From the earlier screenshot, one thing VSCode get a win from me is the super compact code completion dialog. Rider one is way too wide and line height is too big. And there is no way to change this. You can drag the right edge to narrow it, but when it appears again it expands to the longest entry that maybe deep below and you are not likely to access it. In Unity ECS, the verbosity cause this dialog to get unwieldly almost always.
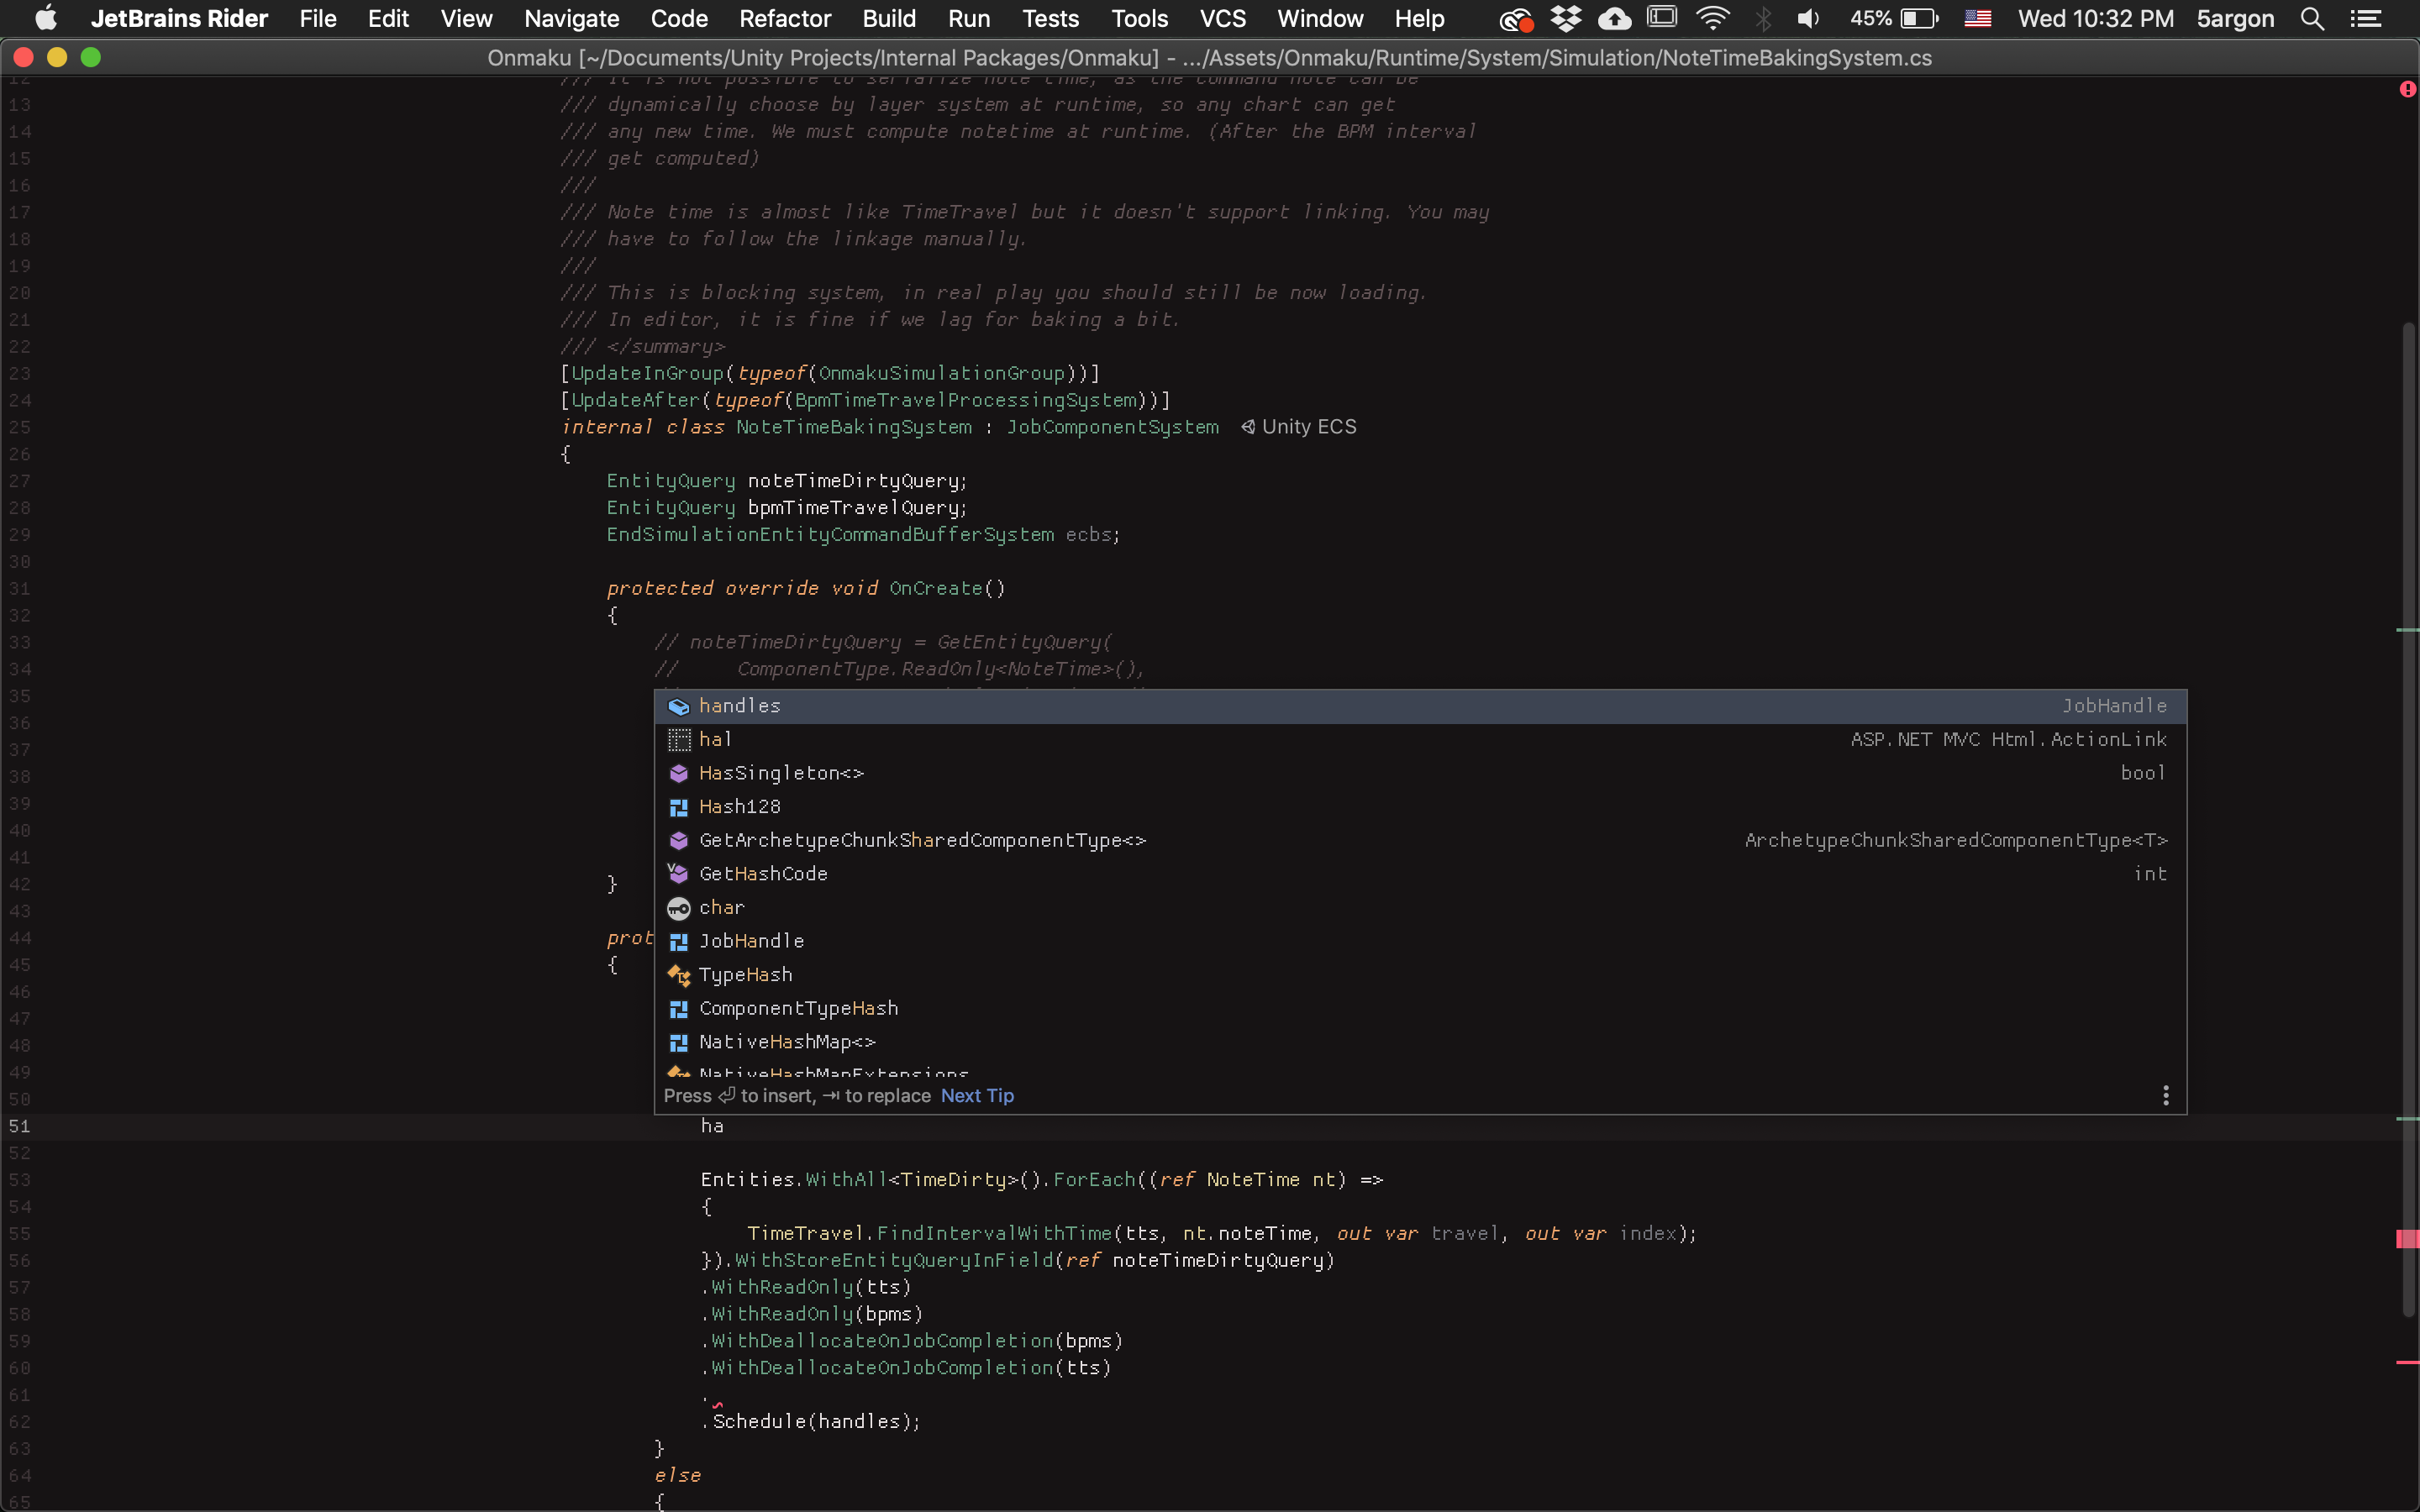
And I really hate it when it go upwards, erasing all my context that I am thinking with. This is because the height is too high. If I could set it to about 4-5 entries then it could have fit below just fine.
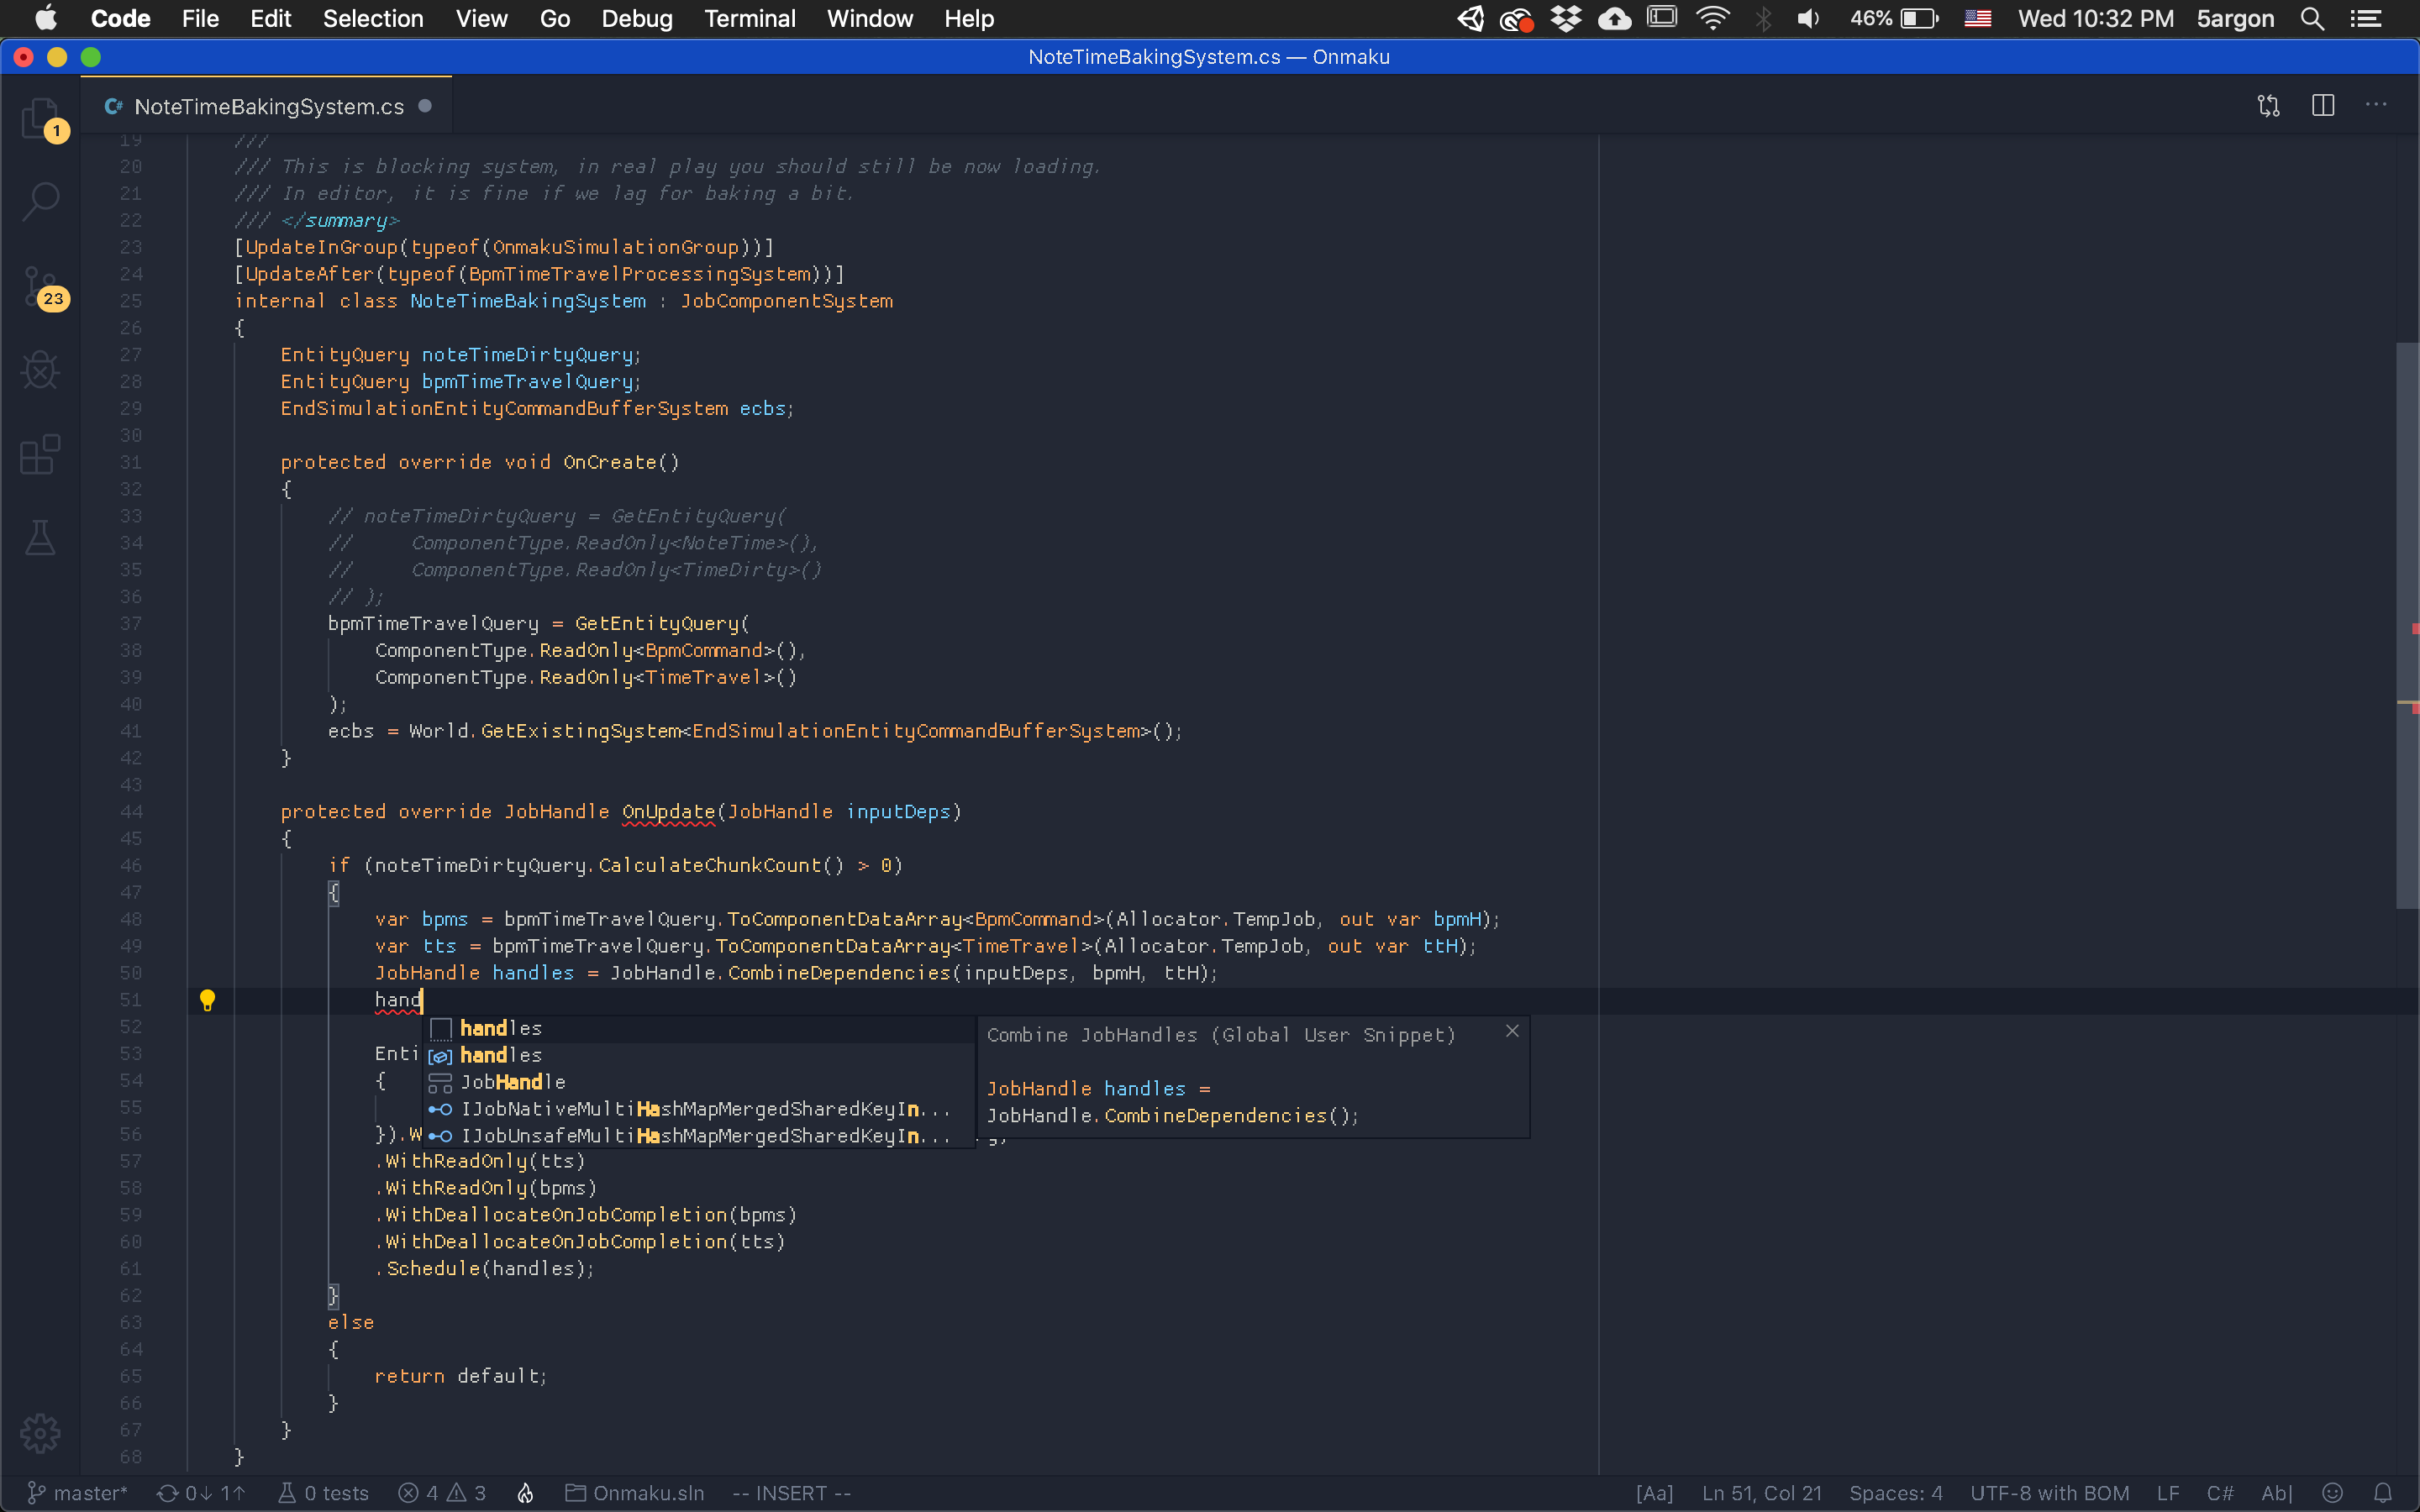
Here's from VSCode. Small and cute. There is no need to show the whole thing. ... is fine 95% of the time. The documentation balloon is equally compact.
Meahwhile look at this Rider documentation balloon. It's huge! And it can also appear if you linger around the code completion box for 1 second, adding up to the clutter. I ended up turn it off because it was too obtrusive and always decided to go upwards.
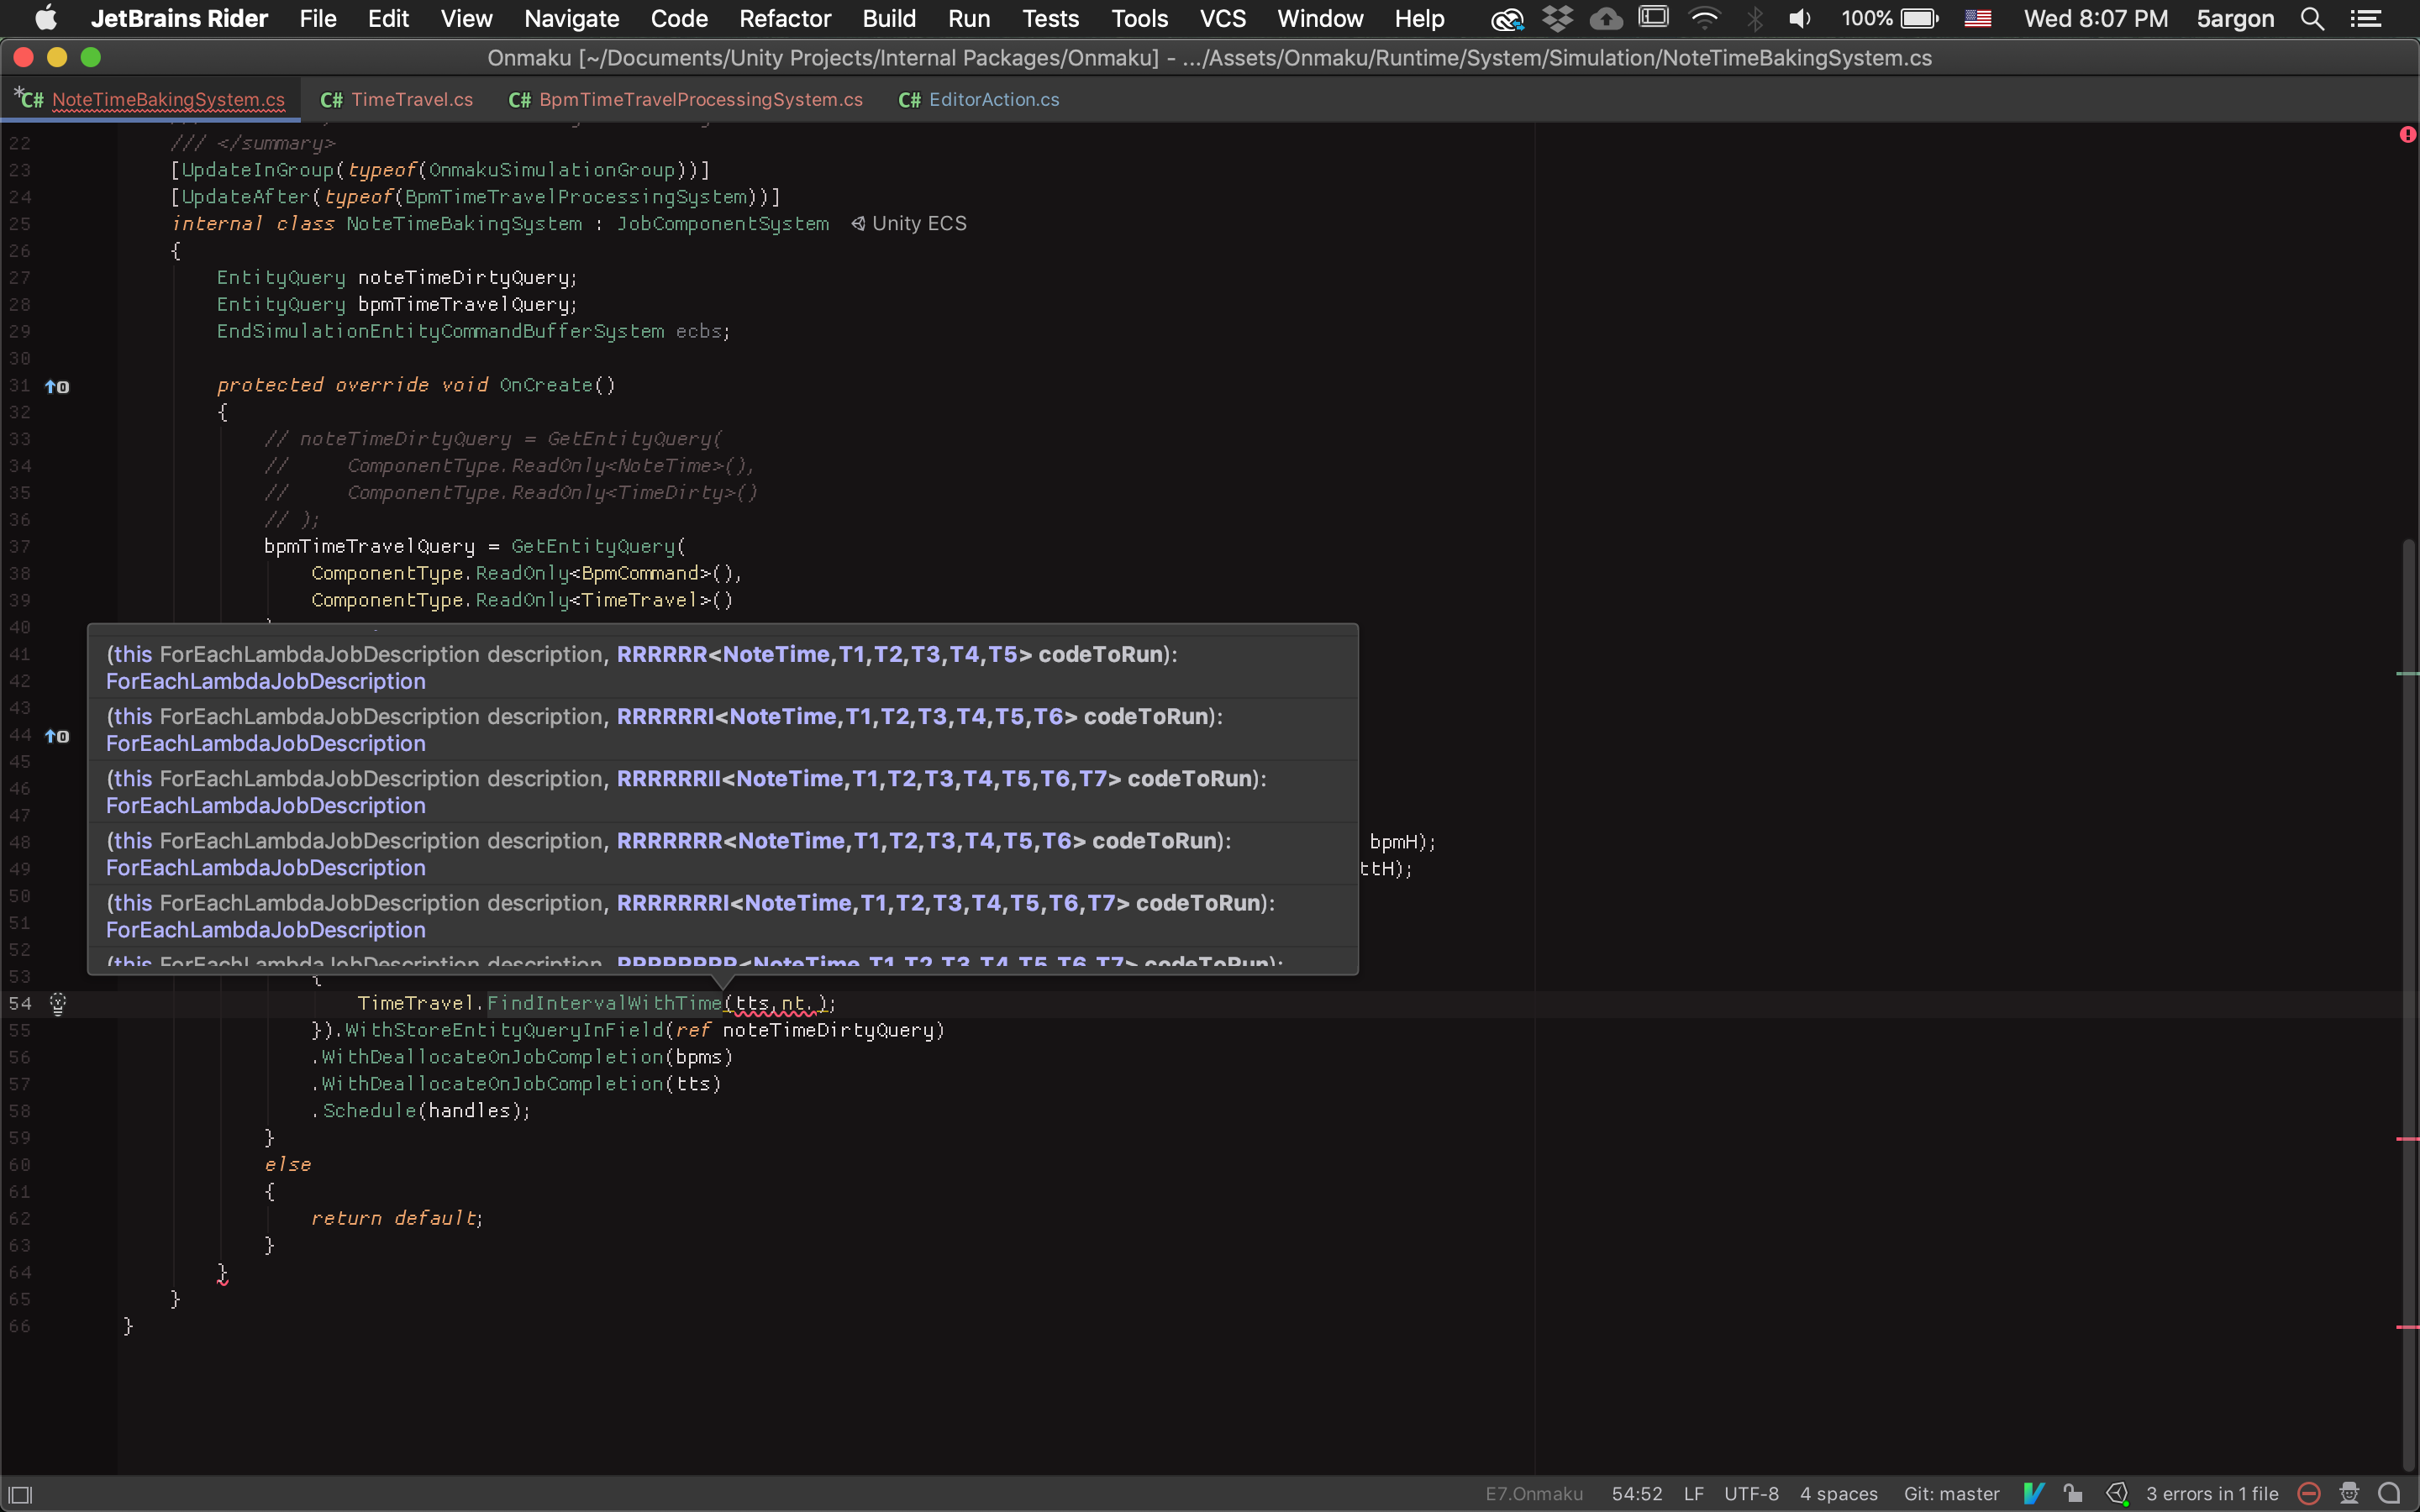
And it is hell with ForEach lambda that contains million of permutations of valid lambdas, basically you take a lag punishment for waiting more than 1 second inside a lambda, that I have to turn it off. Then when I am using a normal method I have to go to definition to see the signature... damn.
Code completion performance
Rider is slow on completion! The VSCode one feels like "just" a string replace. However in Rider you can type ahead of the result and the keystoke can catch up later. It must be because of reformatting stuff and other intelligence. I think I can live with this, but VSCode is more snappy when choosing a code completion. (Also with template/snippet)
This offset with faster Vim performance in Rider however. Moving around the cursor is faster in Rider.
The look can be matched, somewhat
I like VSCode's minimal and blocky look. Some don't like full blown IDE like Rider not because it has heavy startup time, but it looks heavy. You know that feeling when you open Android Studio. You feel tired even before you start working.
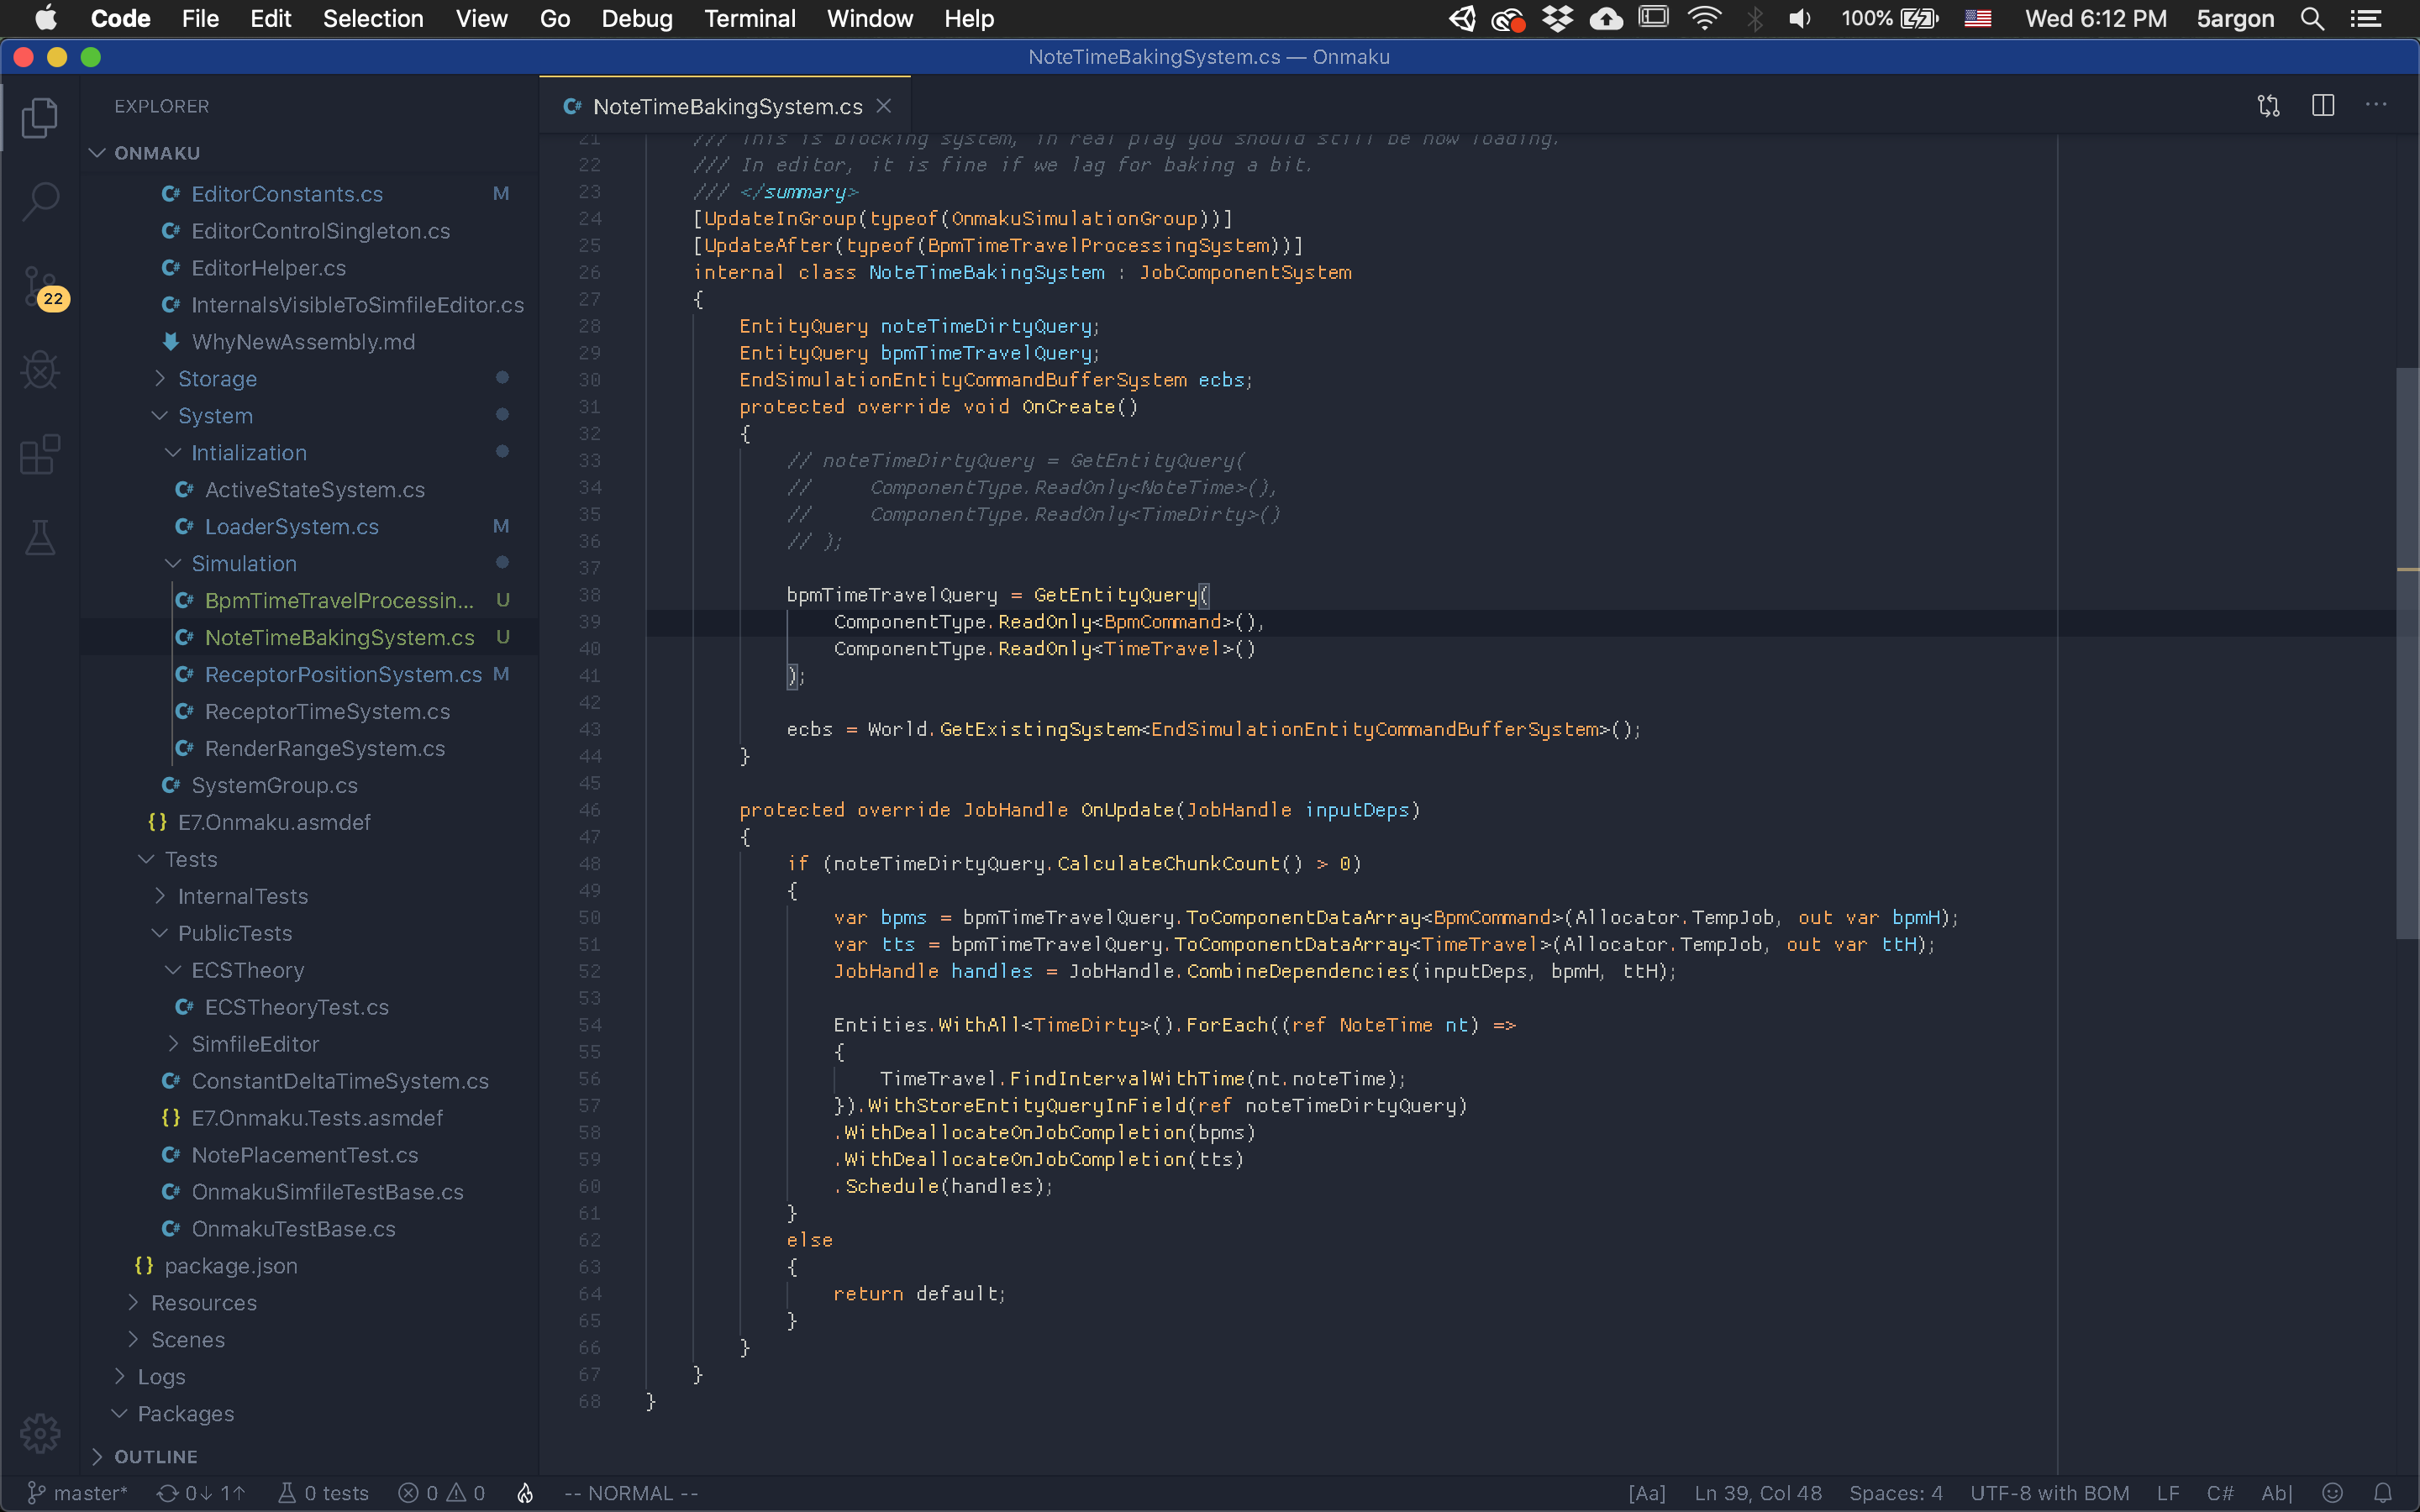
Startup time asides (I don't really care), I could strip off bloated look from Rider until it looks empty just like VSCode. The most important point is one level of top bar. Then one level of bottom bar. And then eliminate the surrounding side bar of features (with rotated text like "Project", "Ve.. that's so distracting) that make you feels like you are coding in a box. You go to View > Appearance to do this. Anti aliasing off on fonts make me alert, it is possible in Rider too in the preferences.
Target
Before
After
With side bar off. Just top and bottom border now.
Editor theme
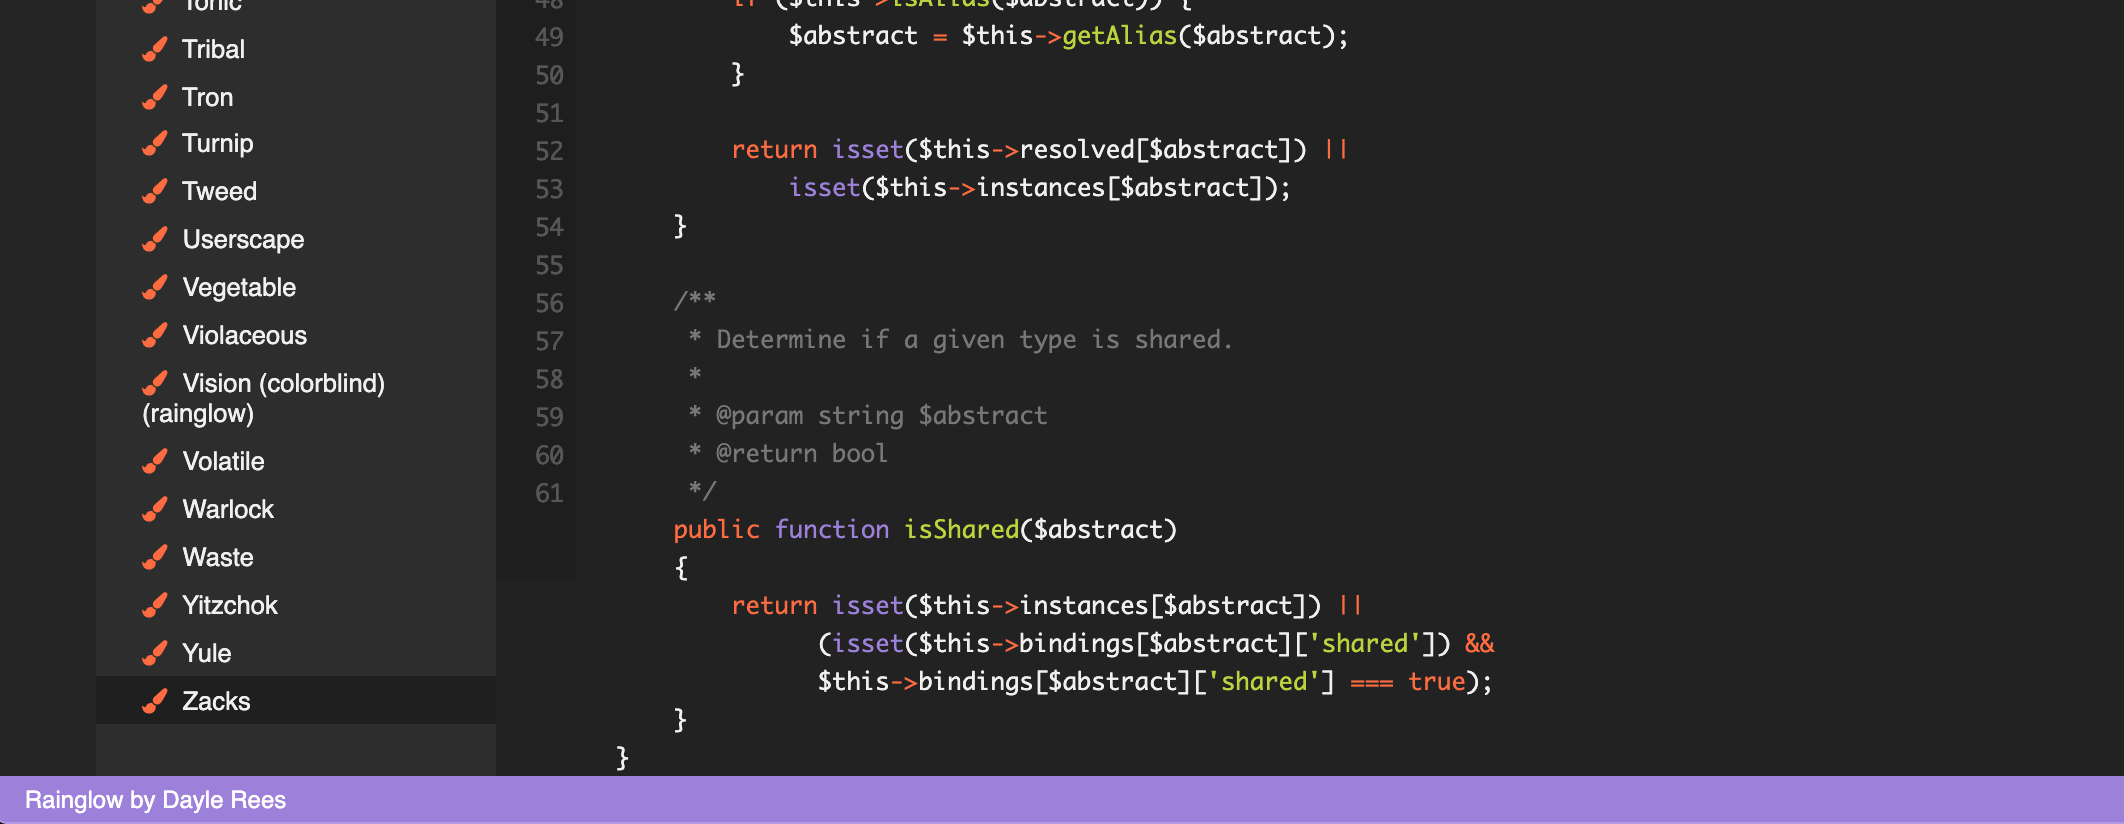
Rainglow theme is also available on Rider. I like changing themes depending on mood rather than trying to "master" a theme, so that's perfect. But there is one thing I like in VSCode, the theme extends to the side bar and not just the editor area. For example this more brown theme, the Rider dark that was fine in the screenshot earlier now looks weird because there are now 2 kind of different temperature of dark. But I hide the sidebar when not used anyways.
Taming rules
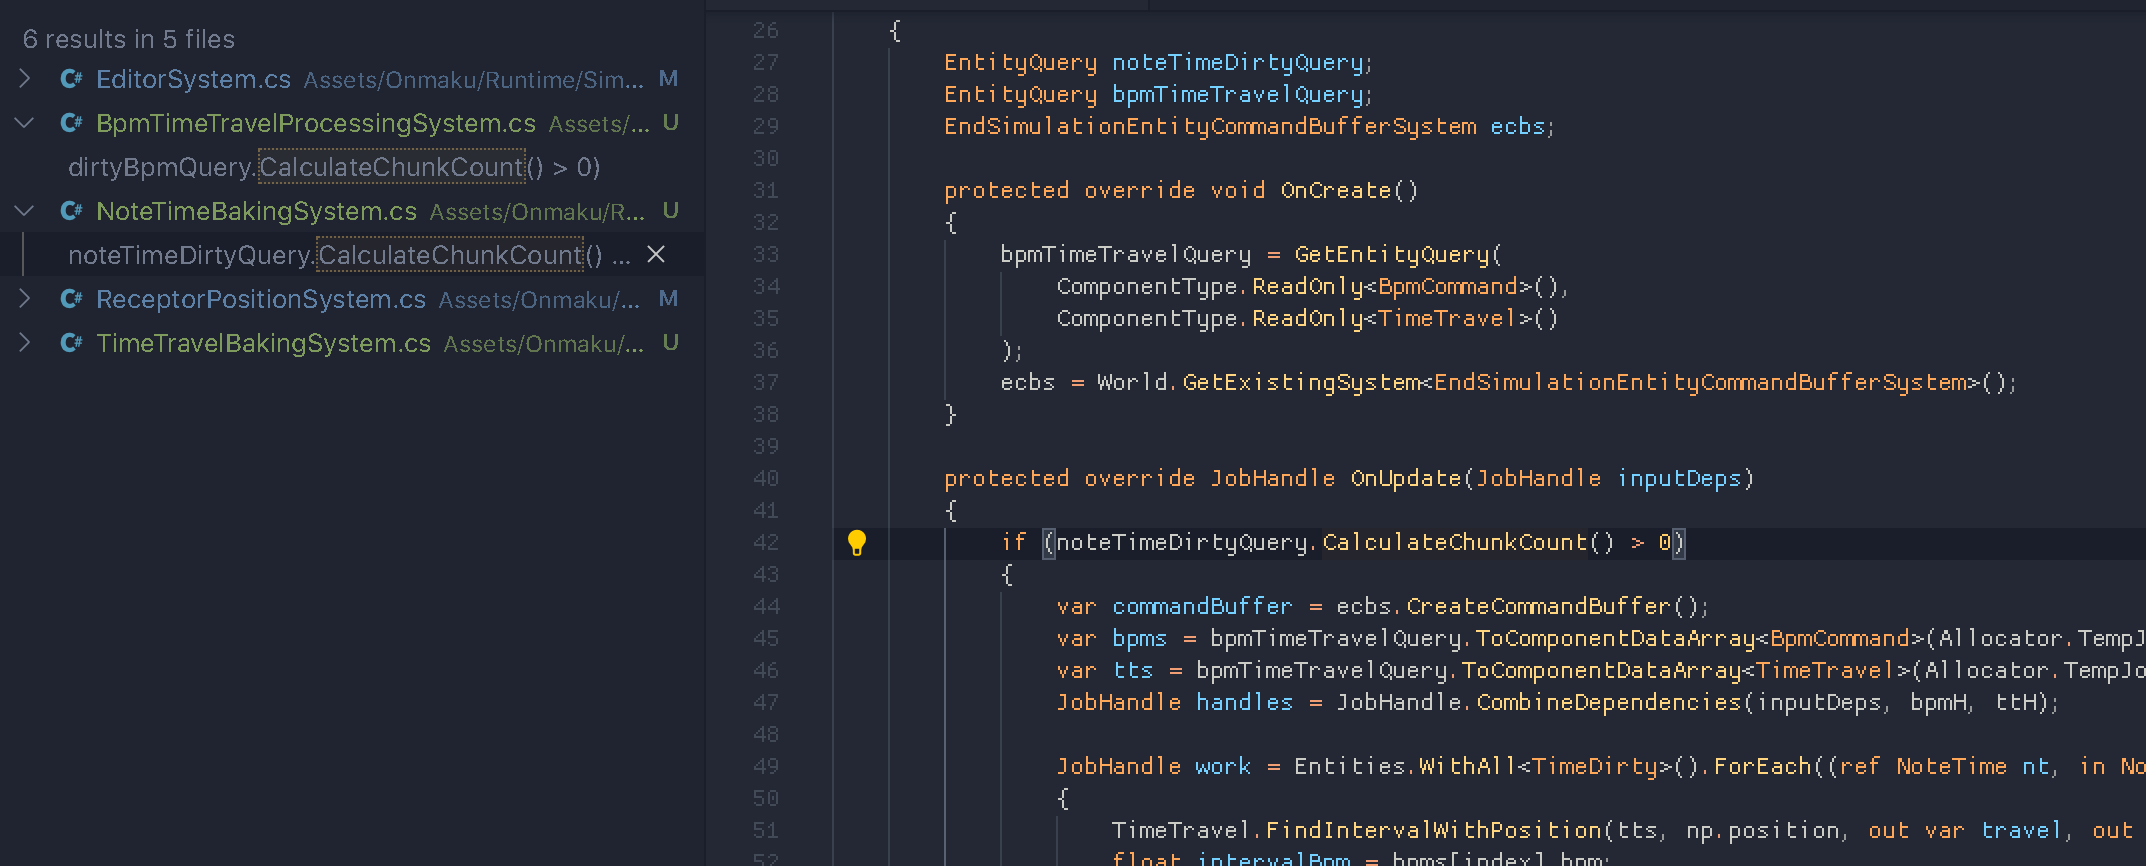
Rider came with rules built-in and my code are all moaning. Luckily I can tame them by clicking the light bulb and select what I want instead of digging preferences.
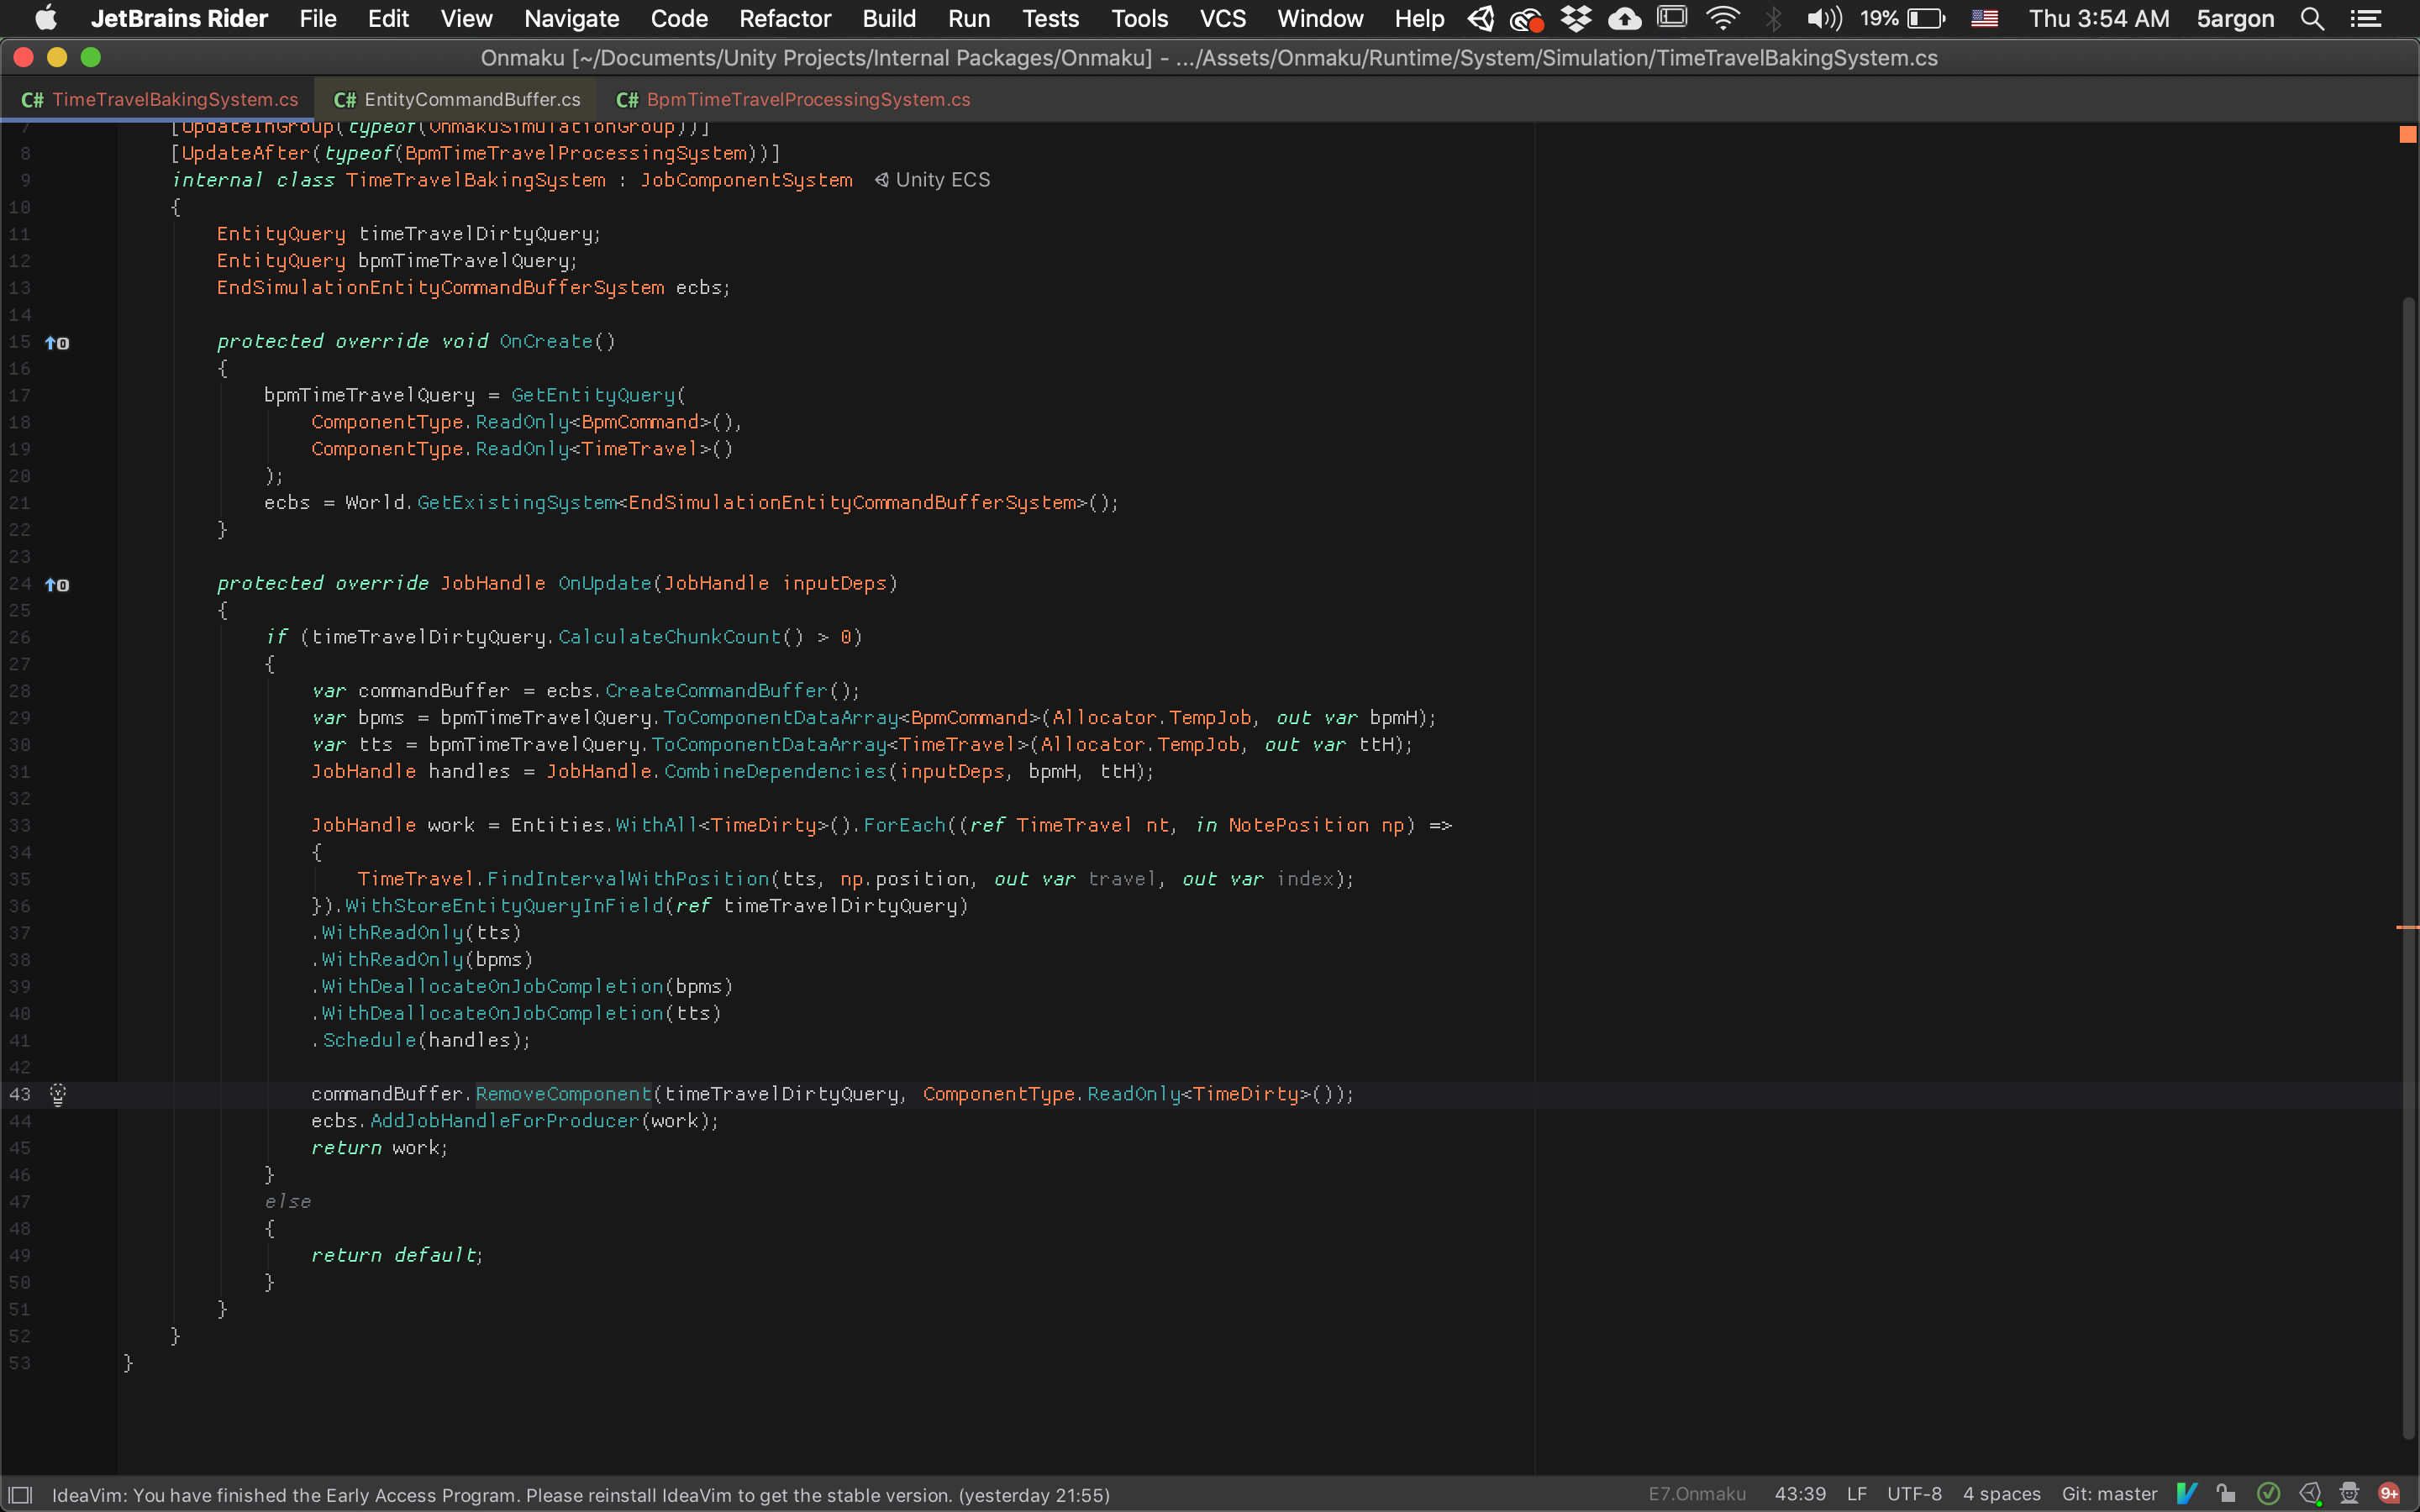
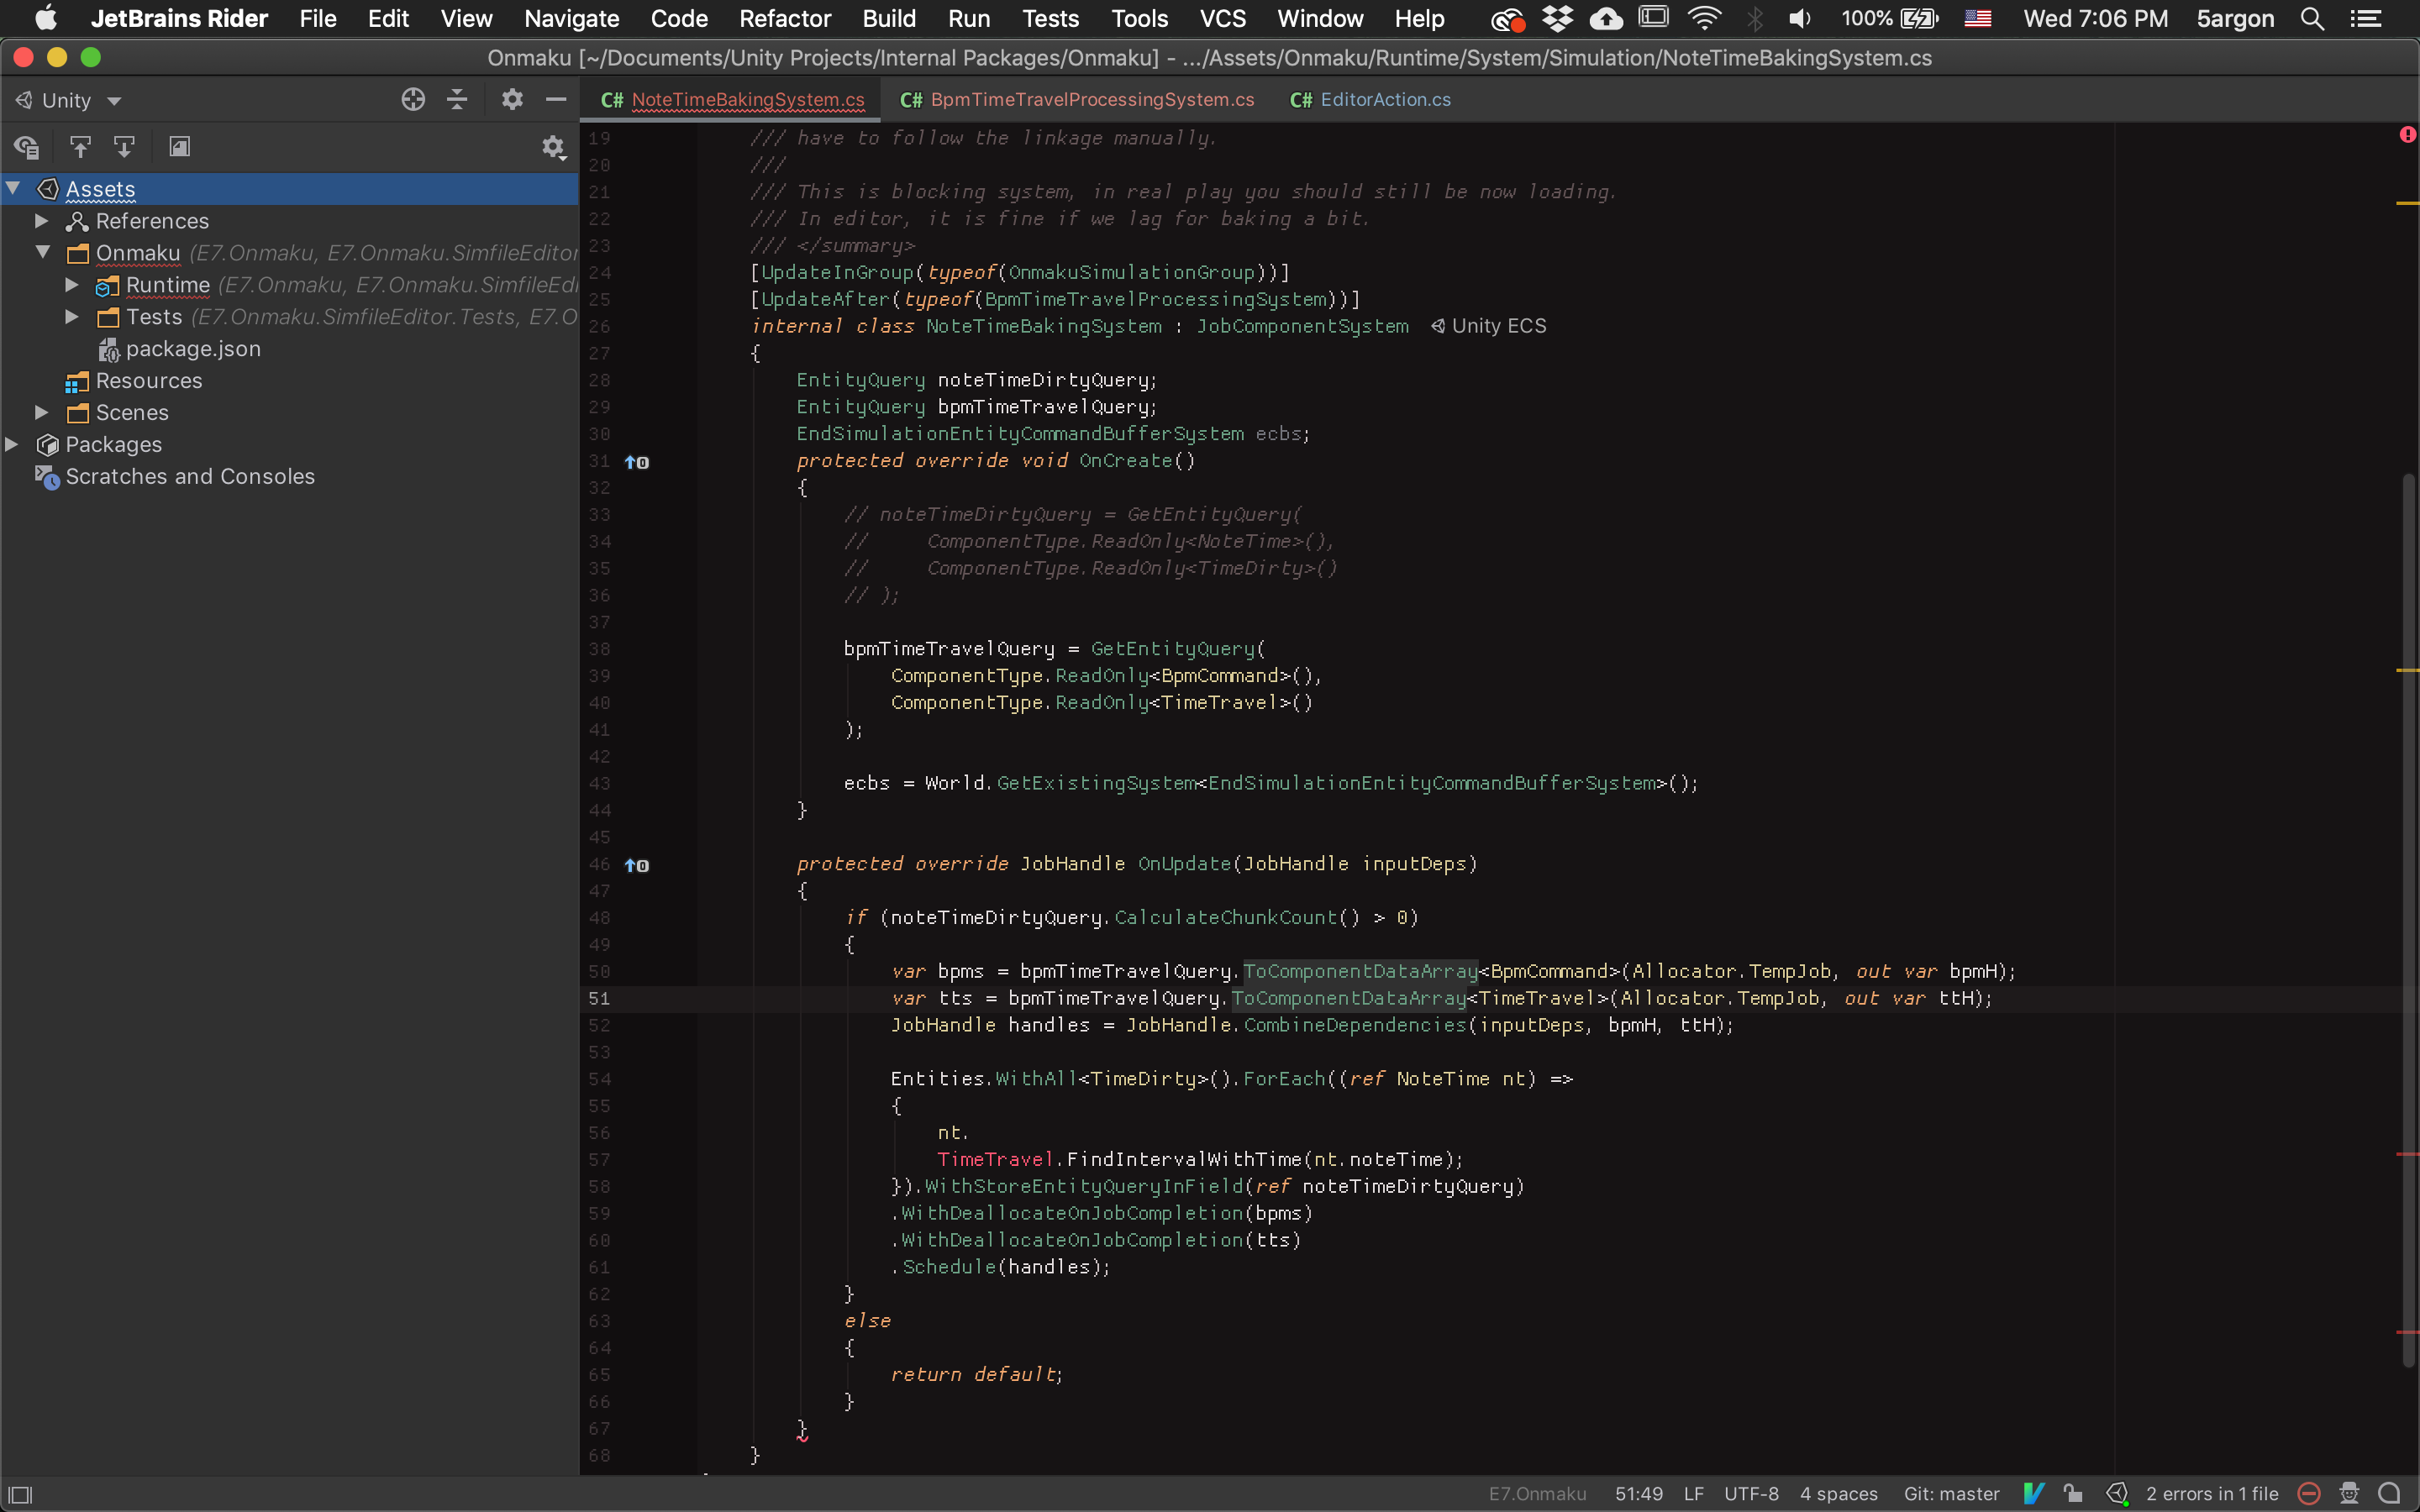
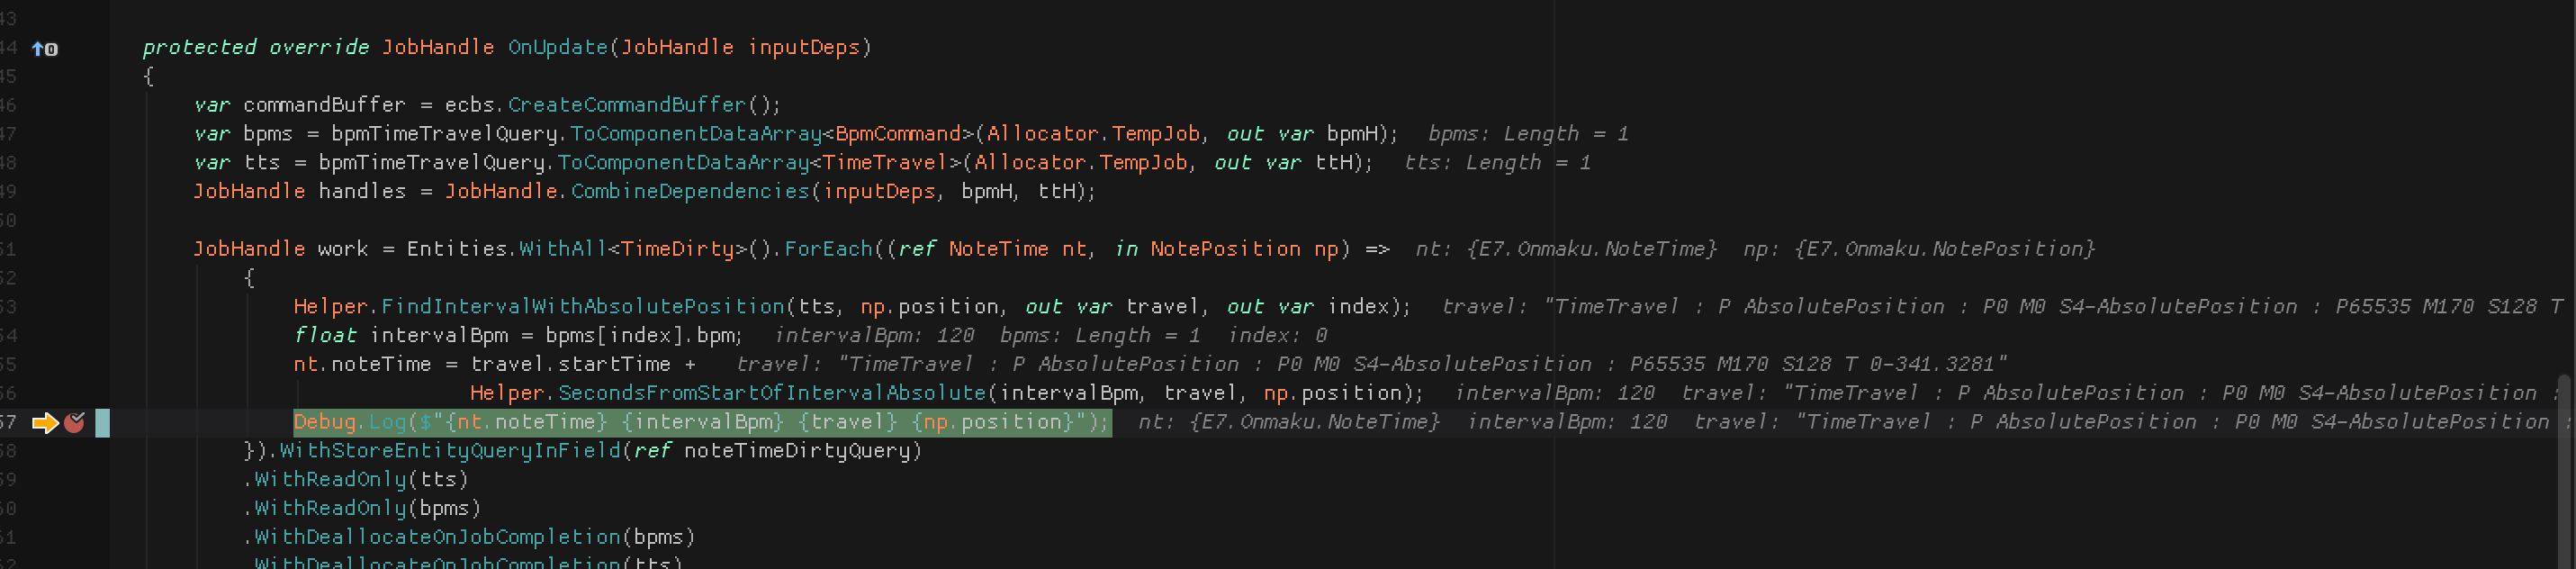
I do think they are too much sometimes, such as the var naming rules. They offer a rule about do/don't use var for simple type, or do/don't use var for when it is "evident". But in real code it is more complicated than that. When I use ToComponentDataArray<T>, it is to my eye "evident" that the type is gonna be NativeArray<T> but of course the rule can't "see". The out var pattern is often conflicting with some rules. And finally sometimes I arbitrarily use or not using var based on how busy the surrounding. (The combined JobHandle need it for emphasis, but the handle returned from out var I don't want to type out JobHandle, etc.) I ended up turning off many of the rules.
In VSCode's first few days I do have to turn something off such as code lens (I hate when my characters move around on their own) or folding, but there are more to turn off in Rider. I spent about 2-3 hours to config Rider fully.
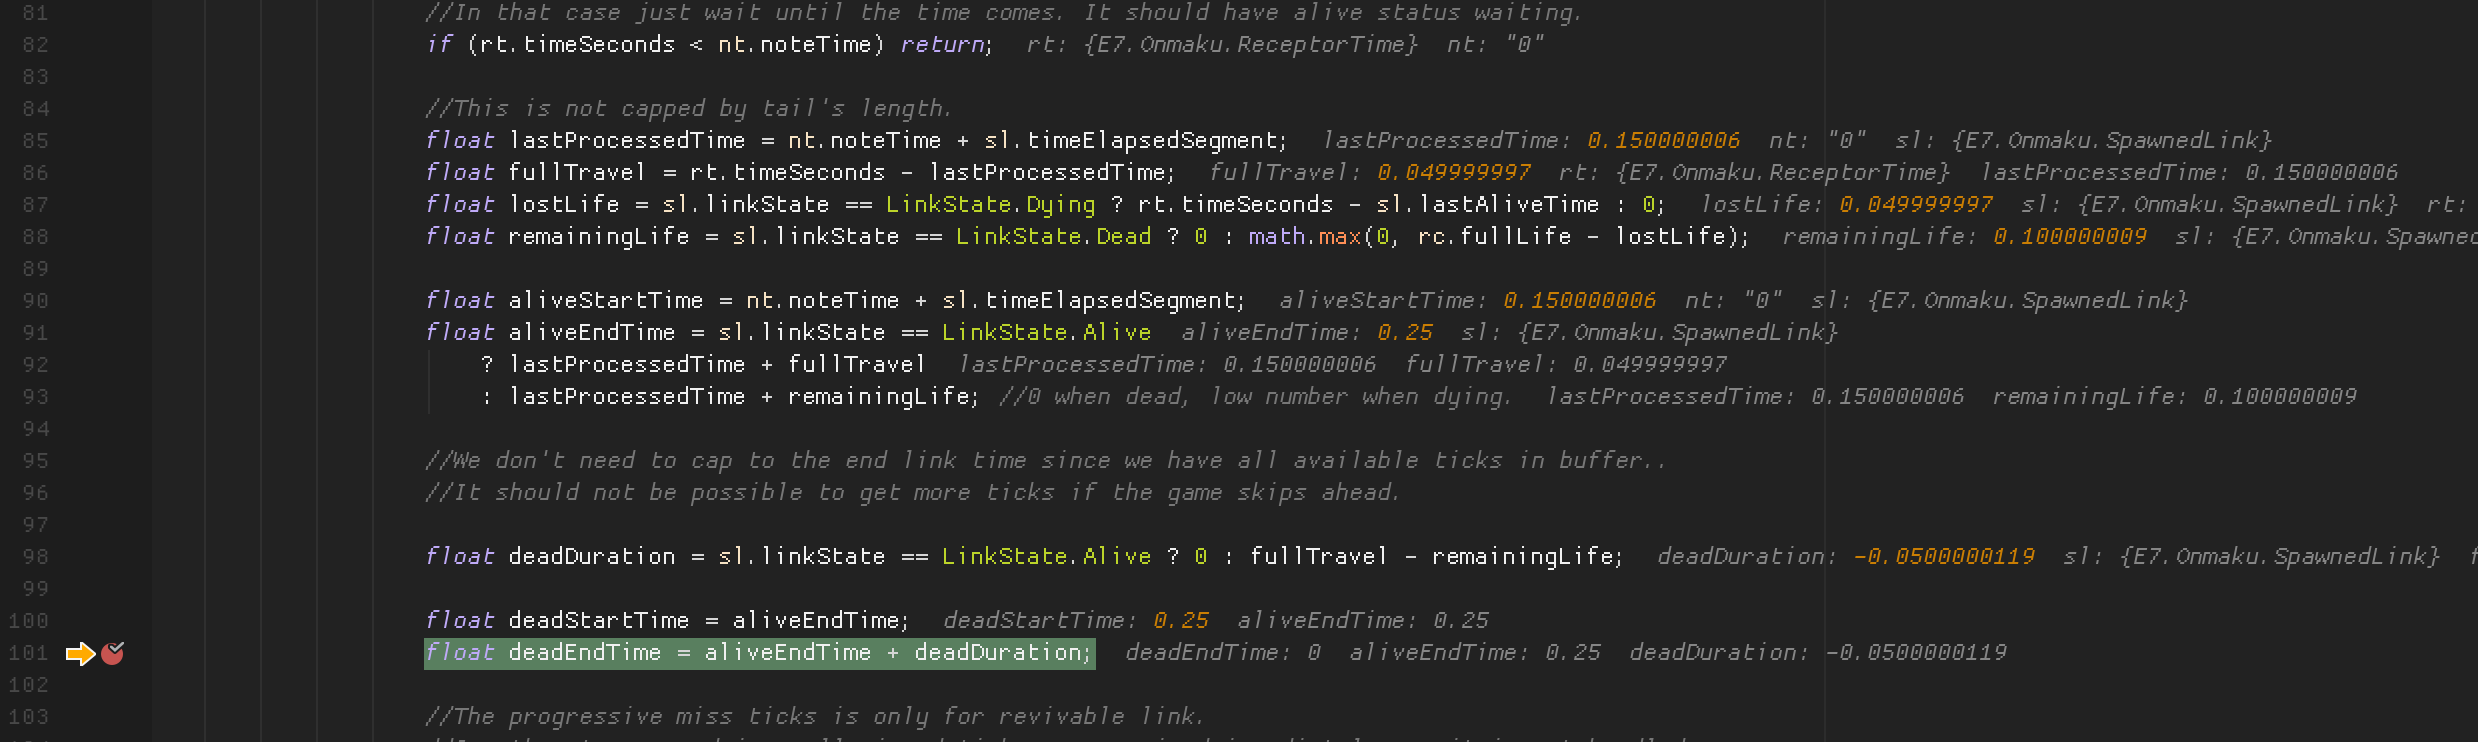
Some rules are annoying though, like float == where I used 0 as special value to trigger some logic. (I don't want to make a new bool)
Code Snippet vs Live Templates
Rider's Live Template wins.. because it works with IdeaVim while VSCode Code Snippet cannot perform parameter transform while in VSCodeVim. Yeah it's all about Vim for me, can't be helped...
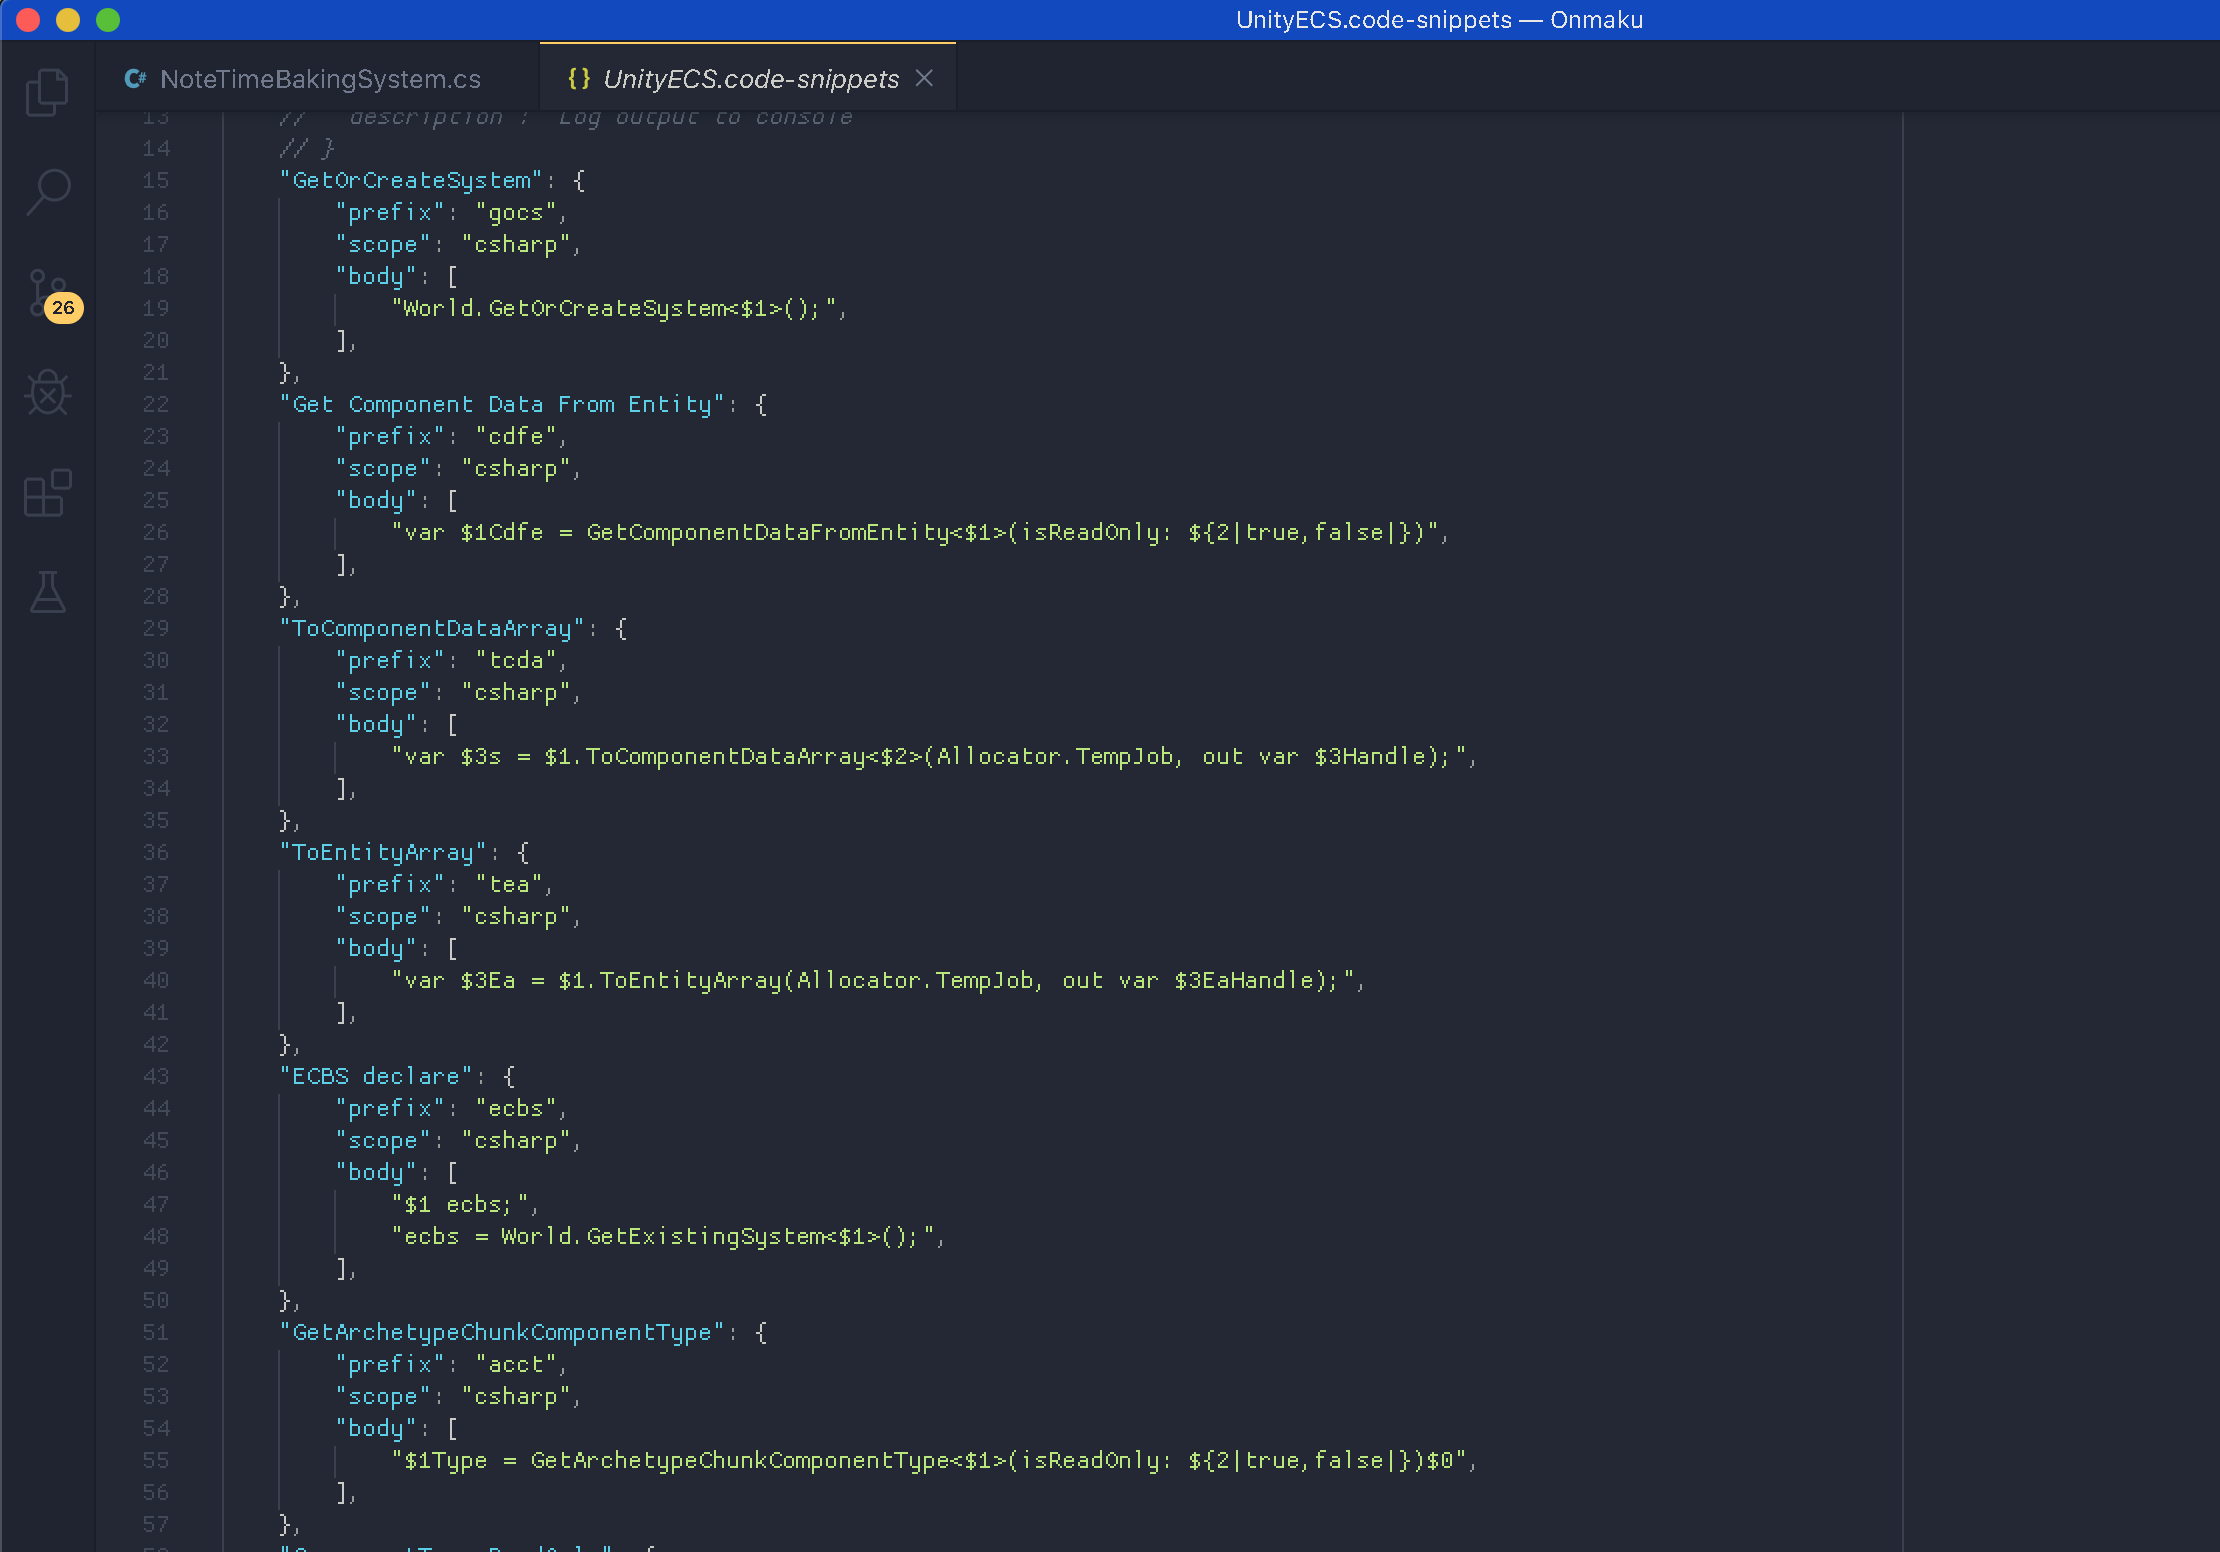
Here is an example of snippet config file from VSCode. Each $ represent where your cursor will go on each tab. You can perform some transformation with regex on them. See more : https://code.visualstudio.com/docs/editor/userdefinedsnippets
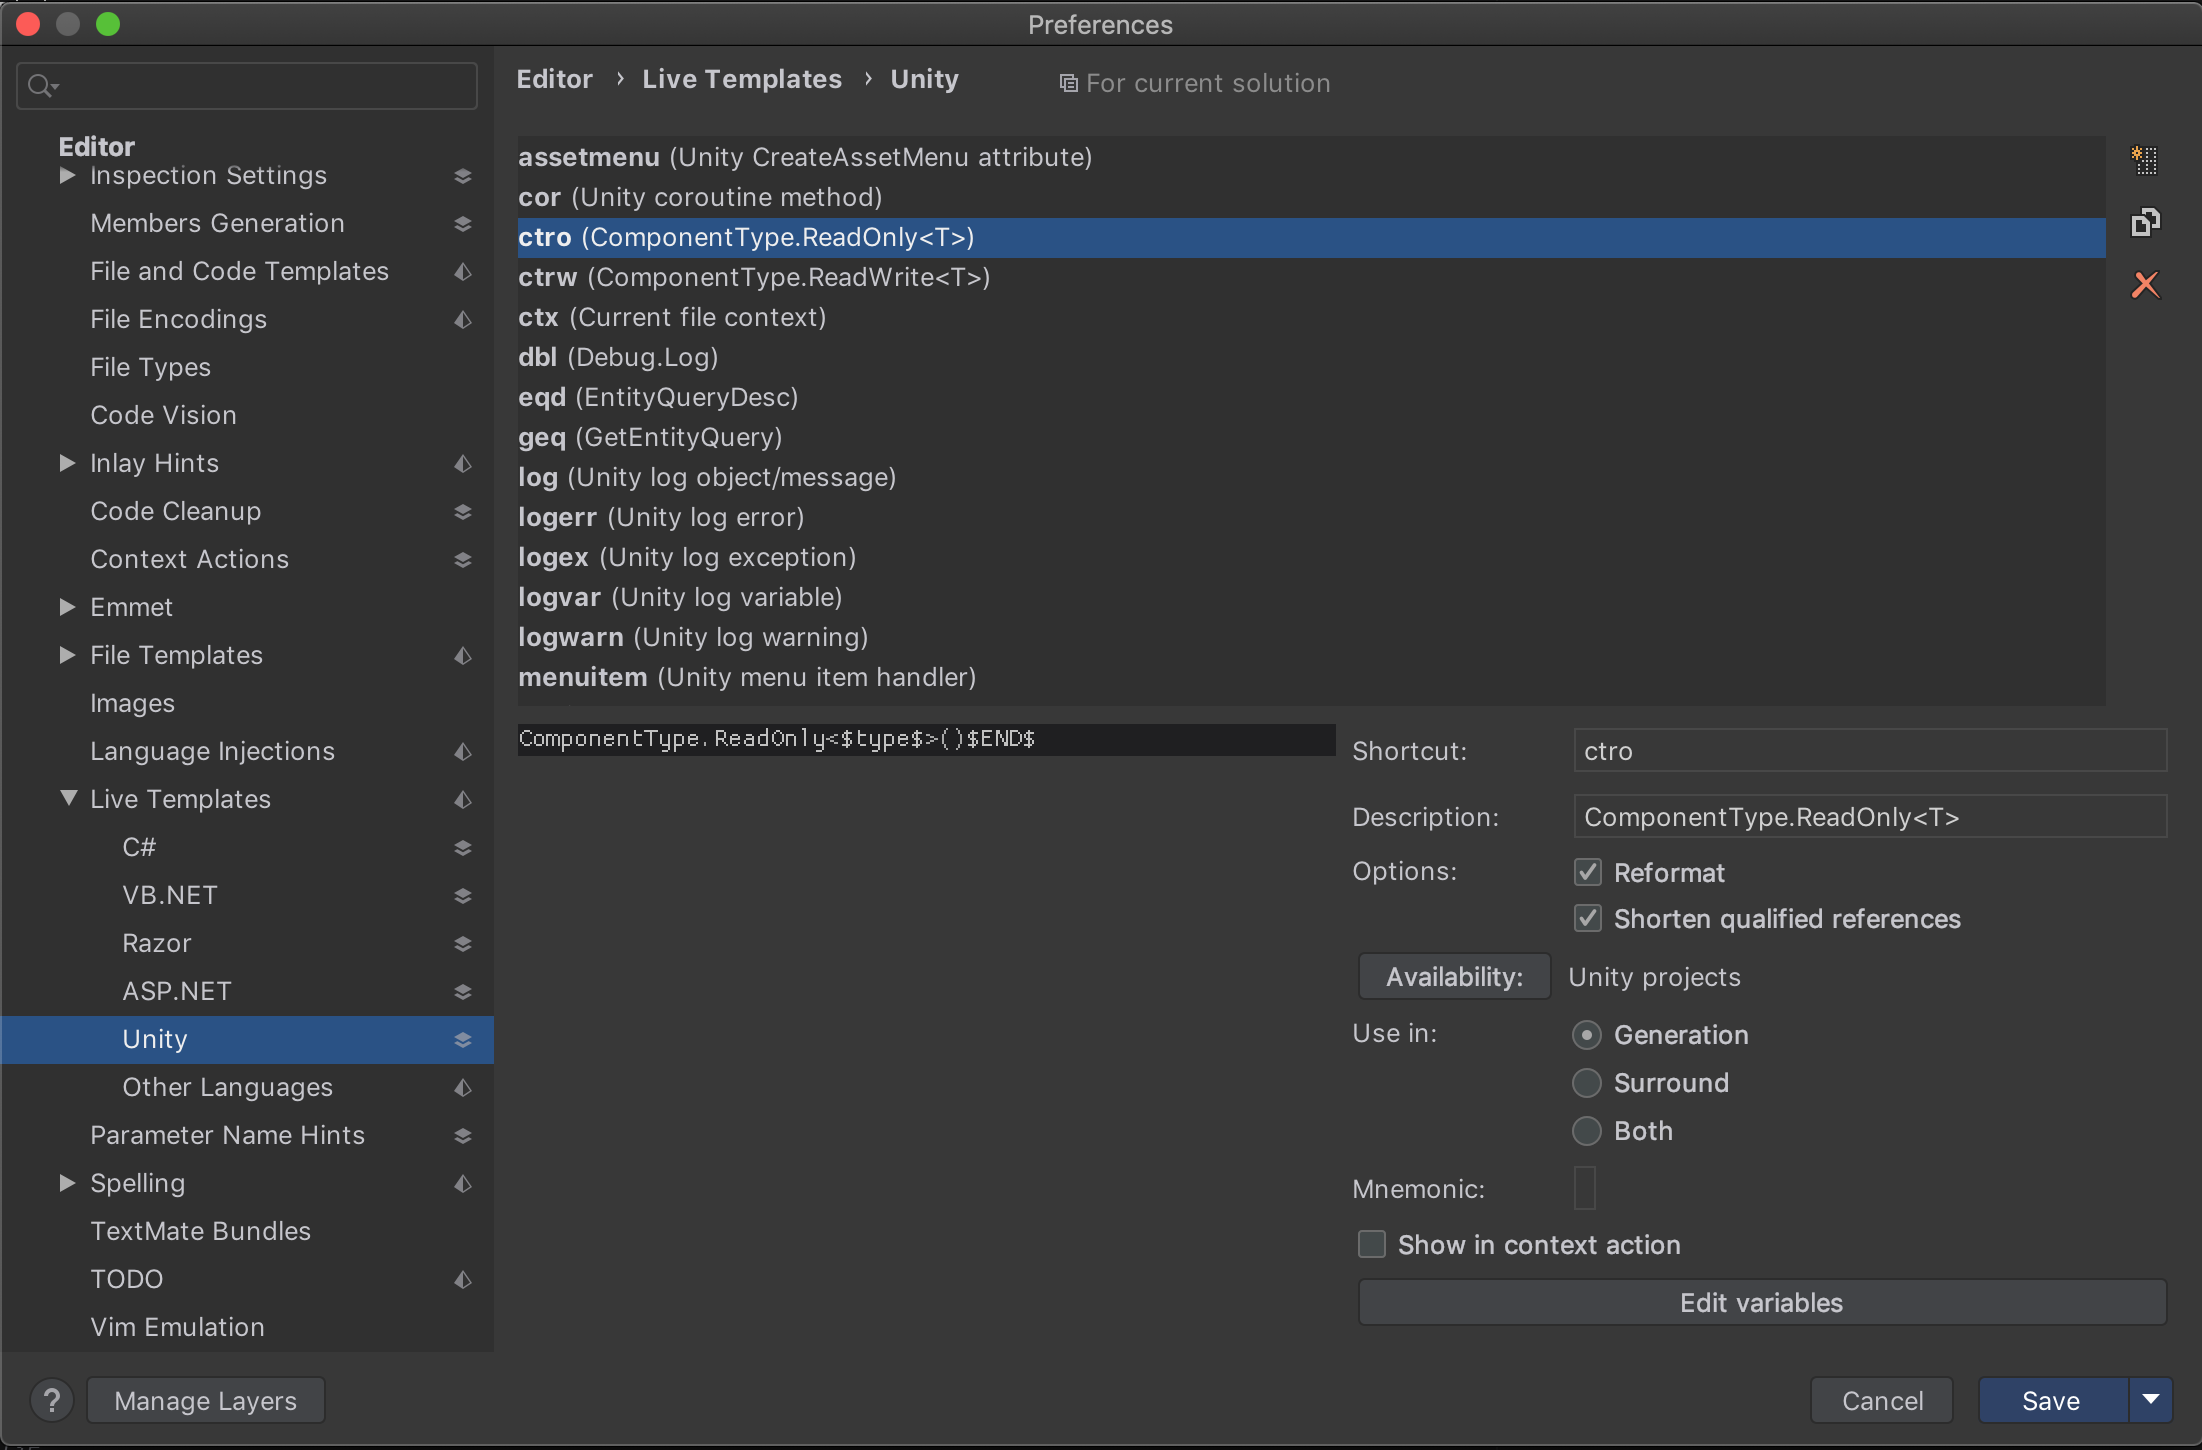
In Rider, I like that I can name my variable whatever I want like $type$ here. I haven't read yet how to perform variable transform. (So the type name inside <> could also become variable name but in camel case, for example.)
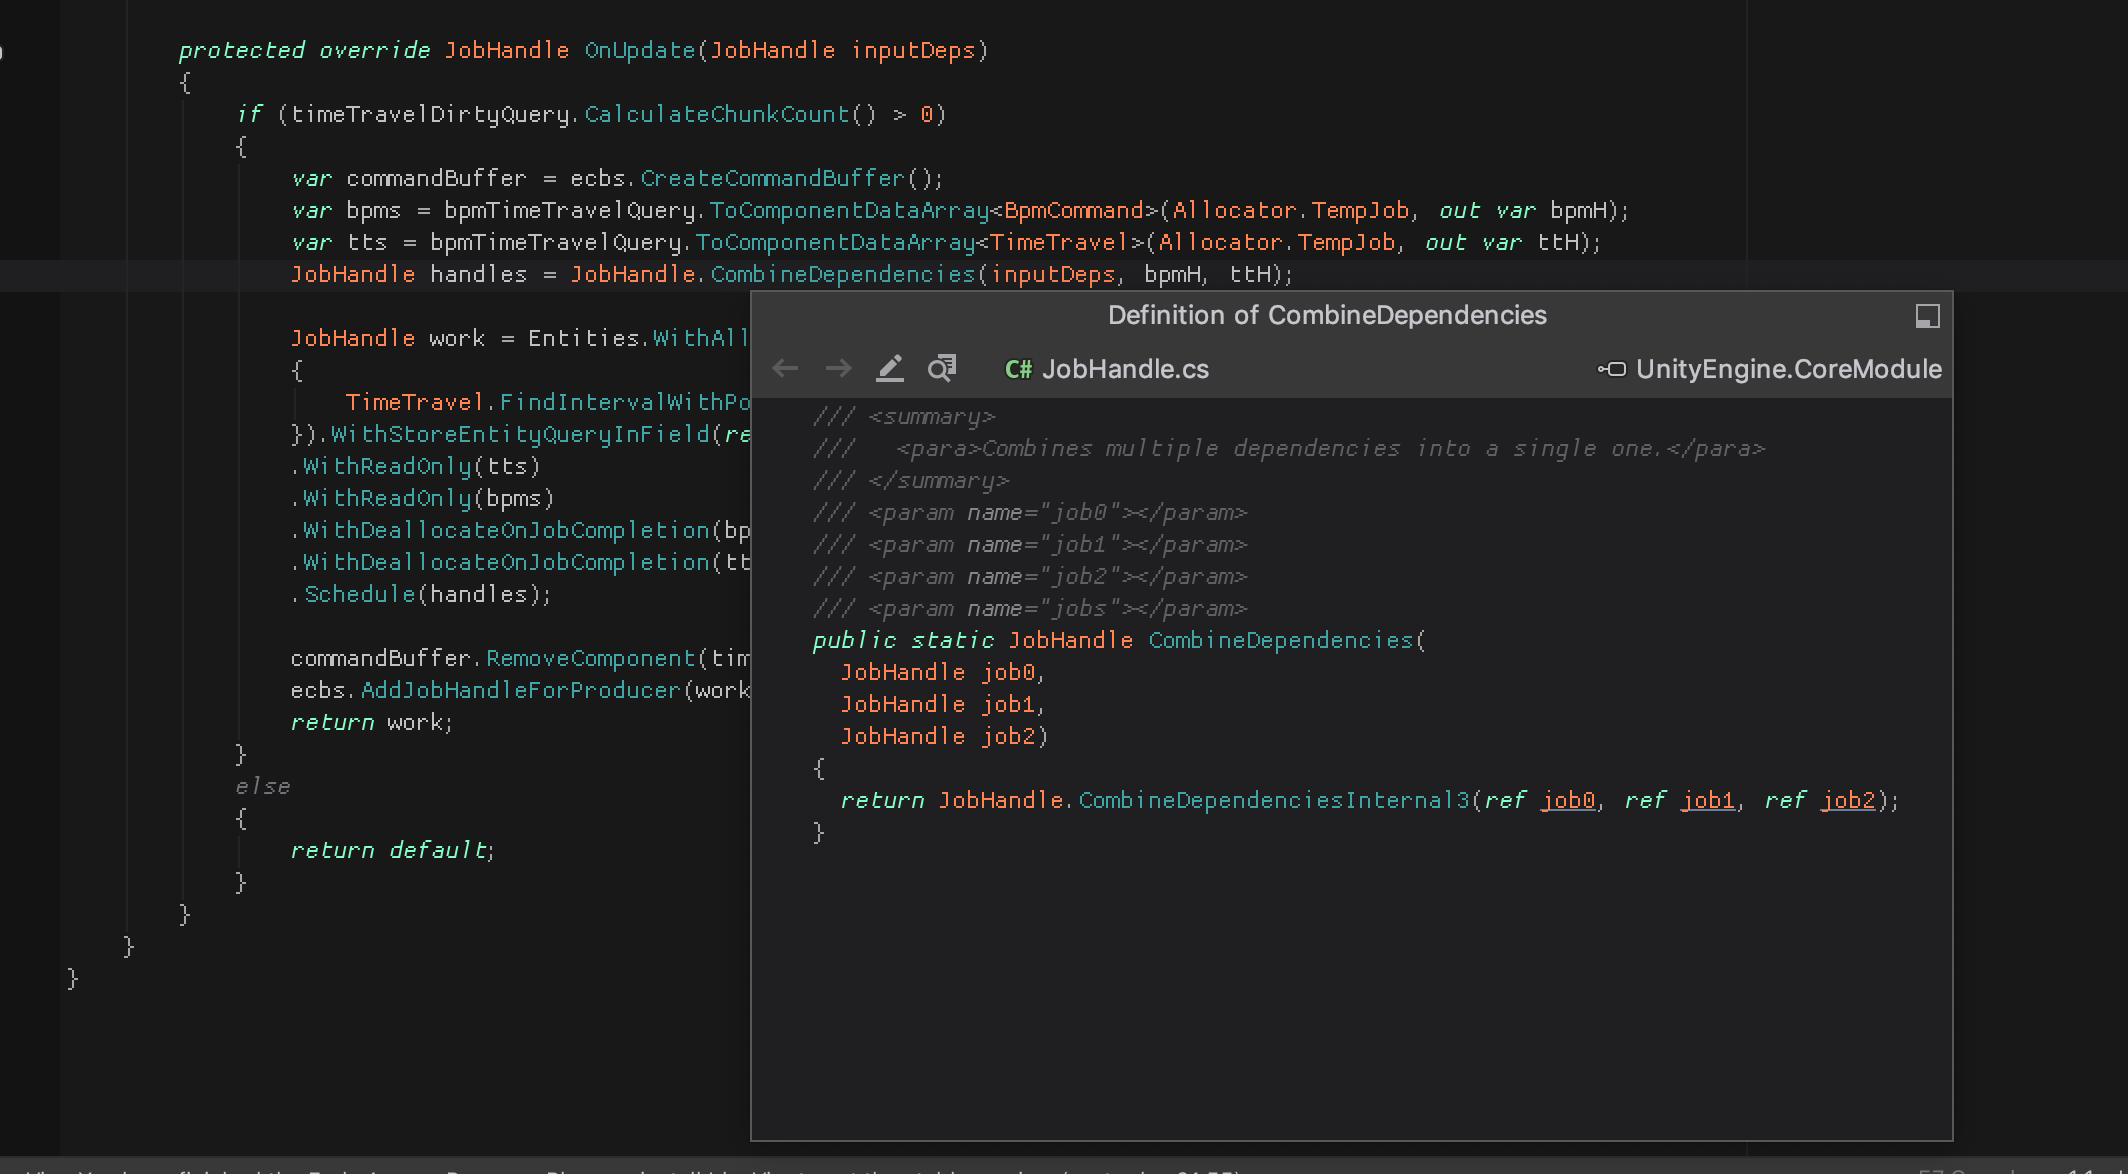
Follow deep into the package
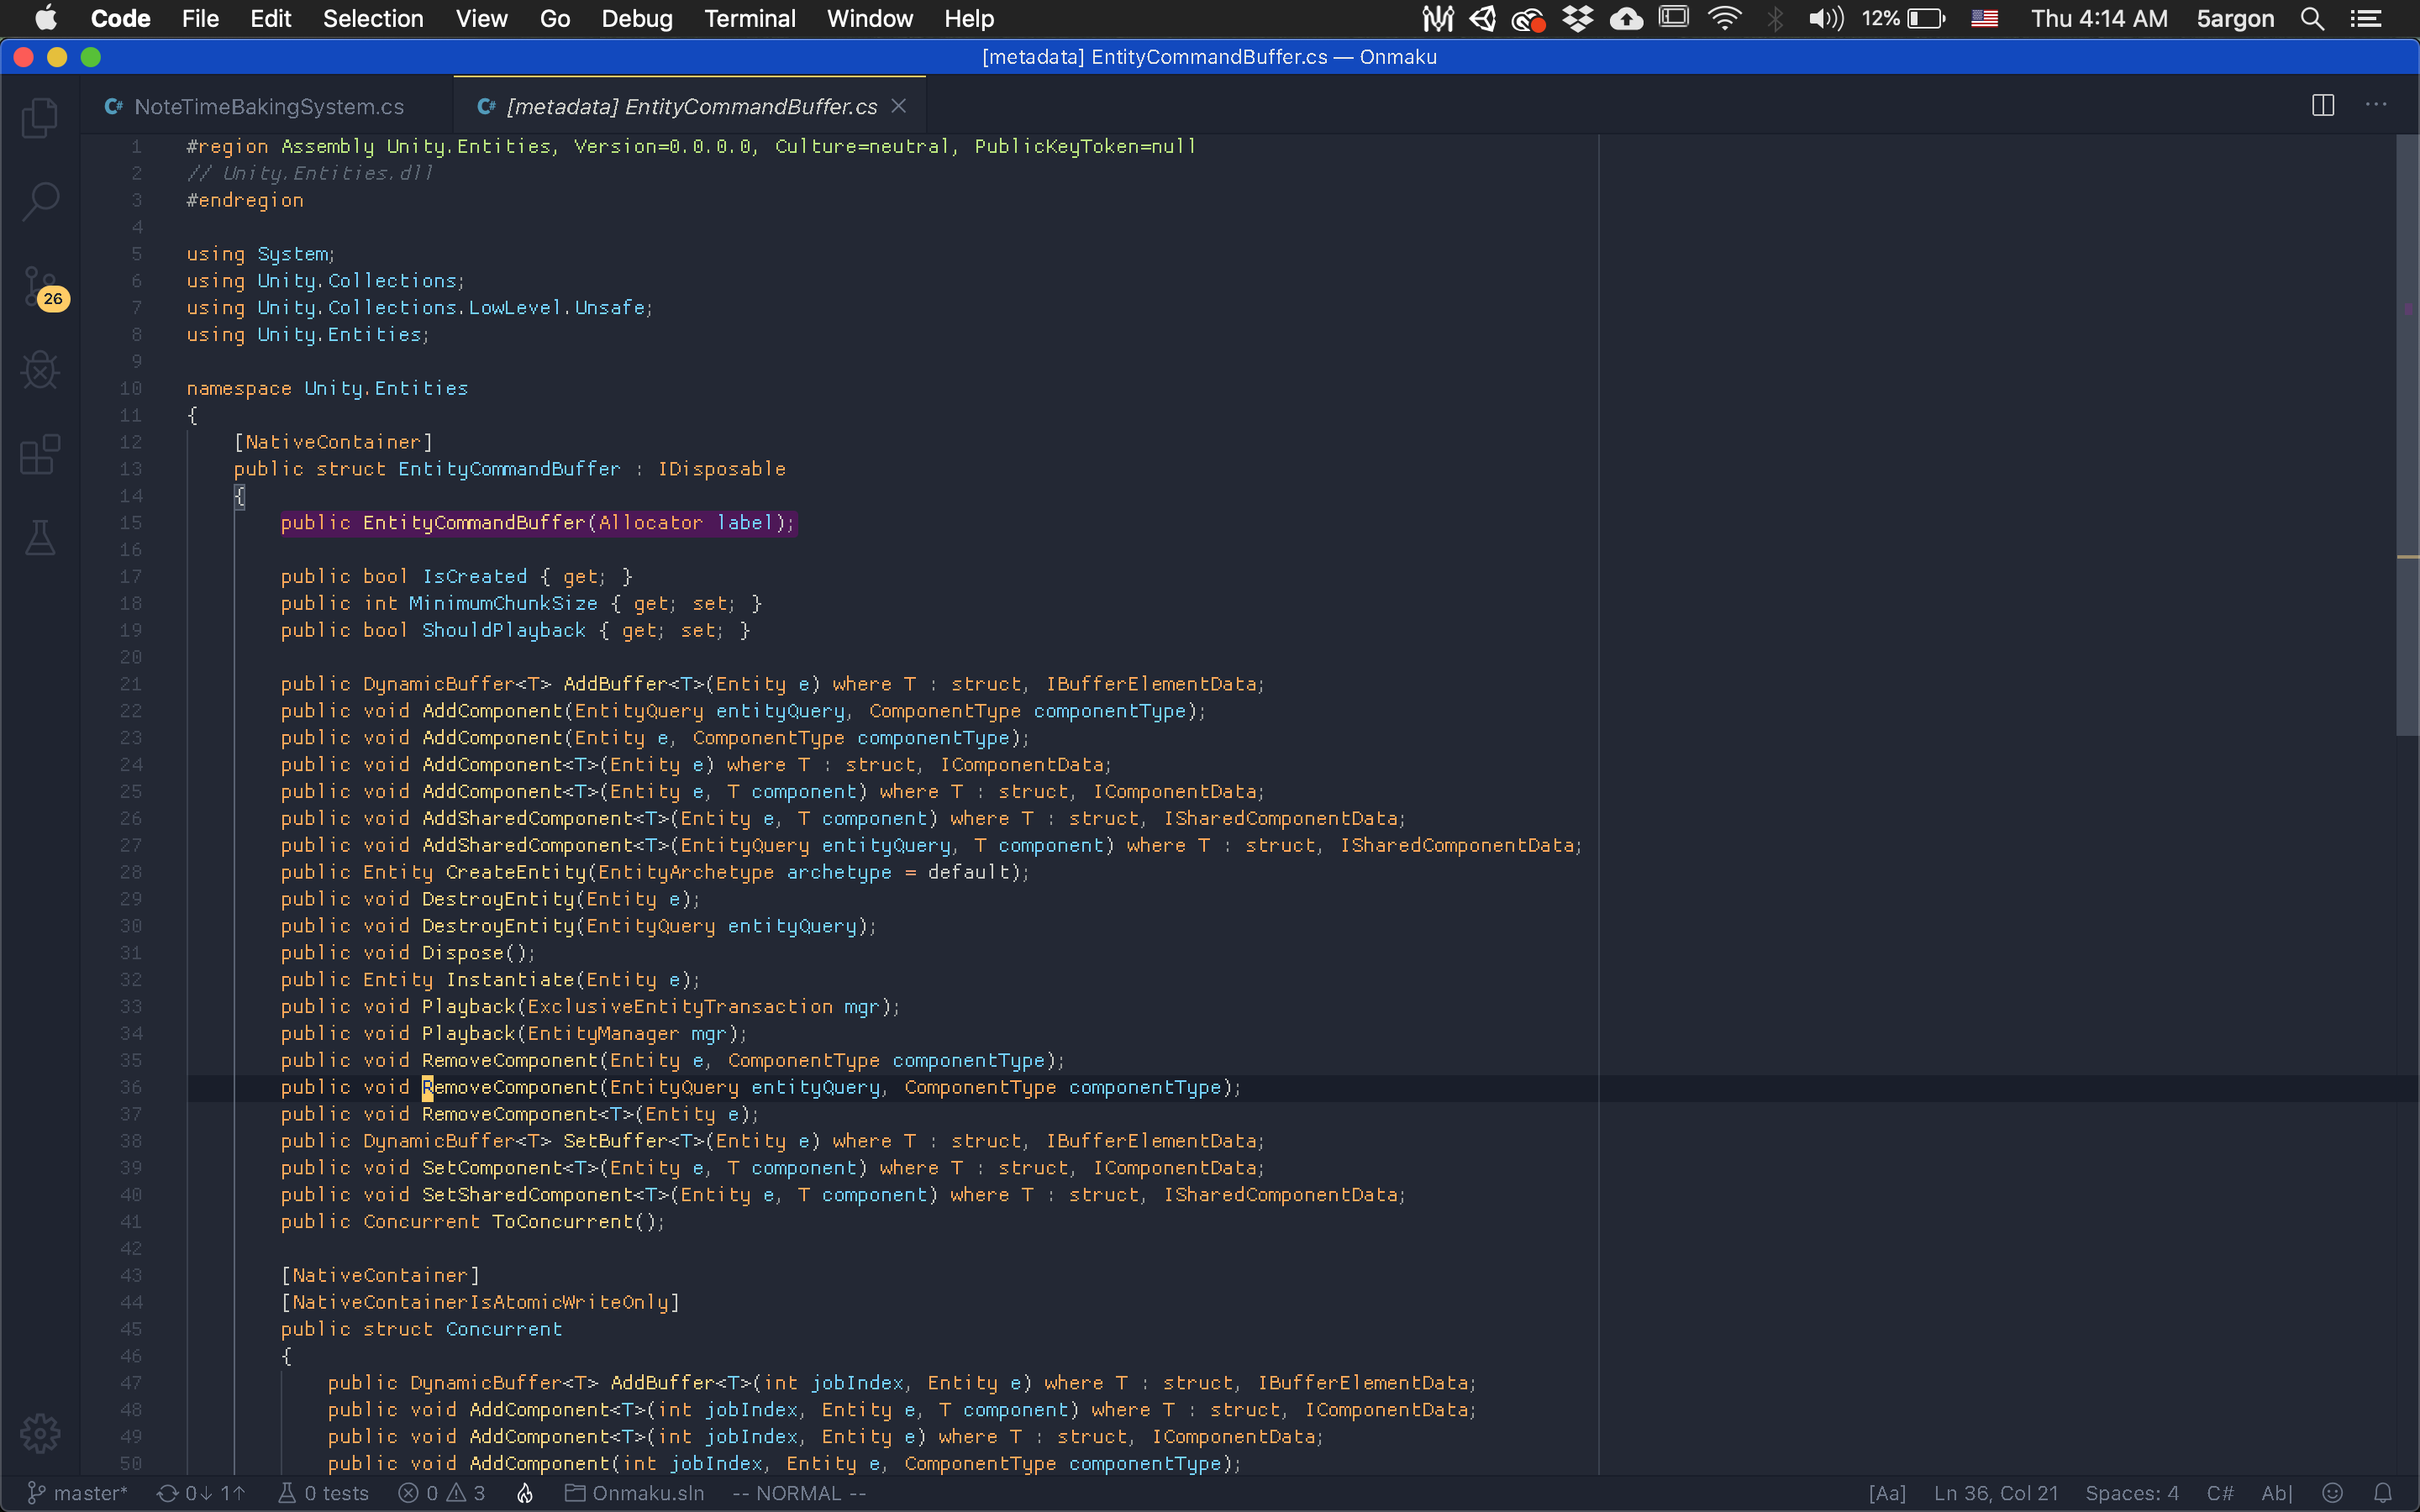
VSCode do not understand Unity, and when you try to follow something into the package, it ask the C# project file and found that it is a dll, and so it dig into the dll (generated from asmdef) instead of an actual package source code that is also available somewhere else.
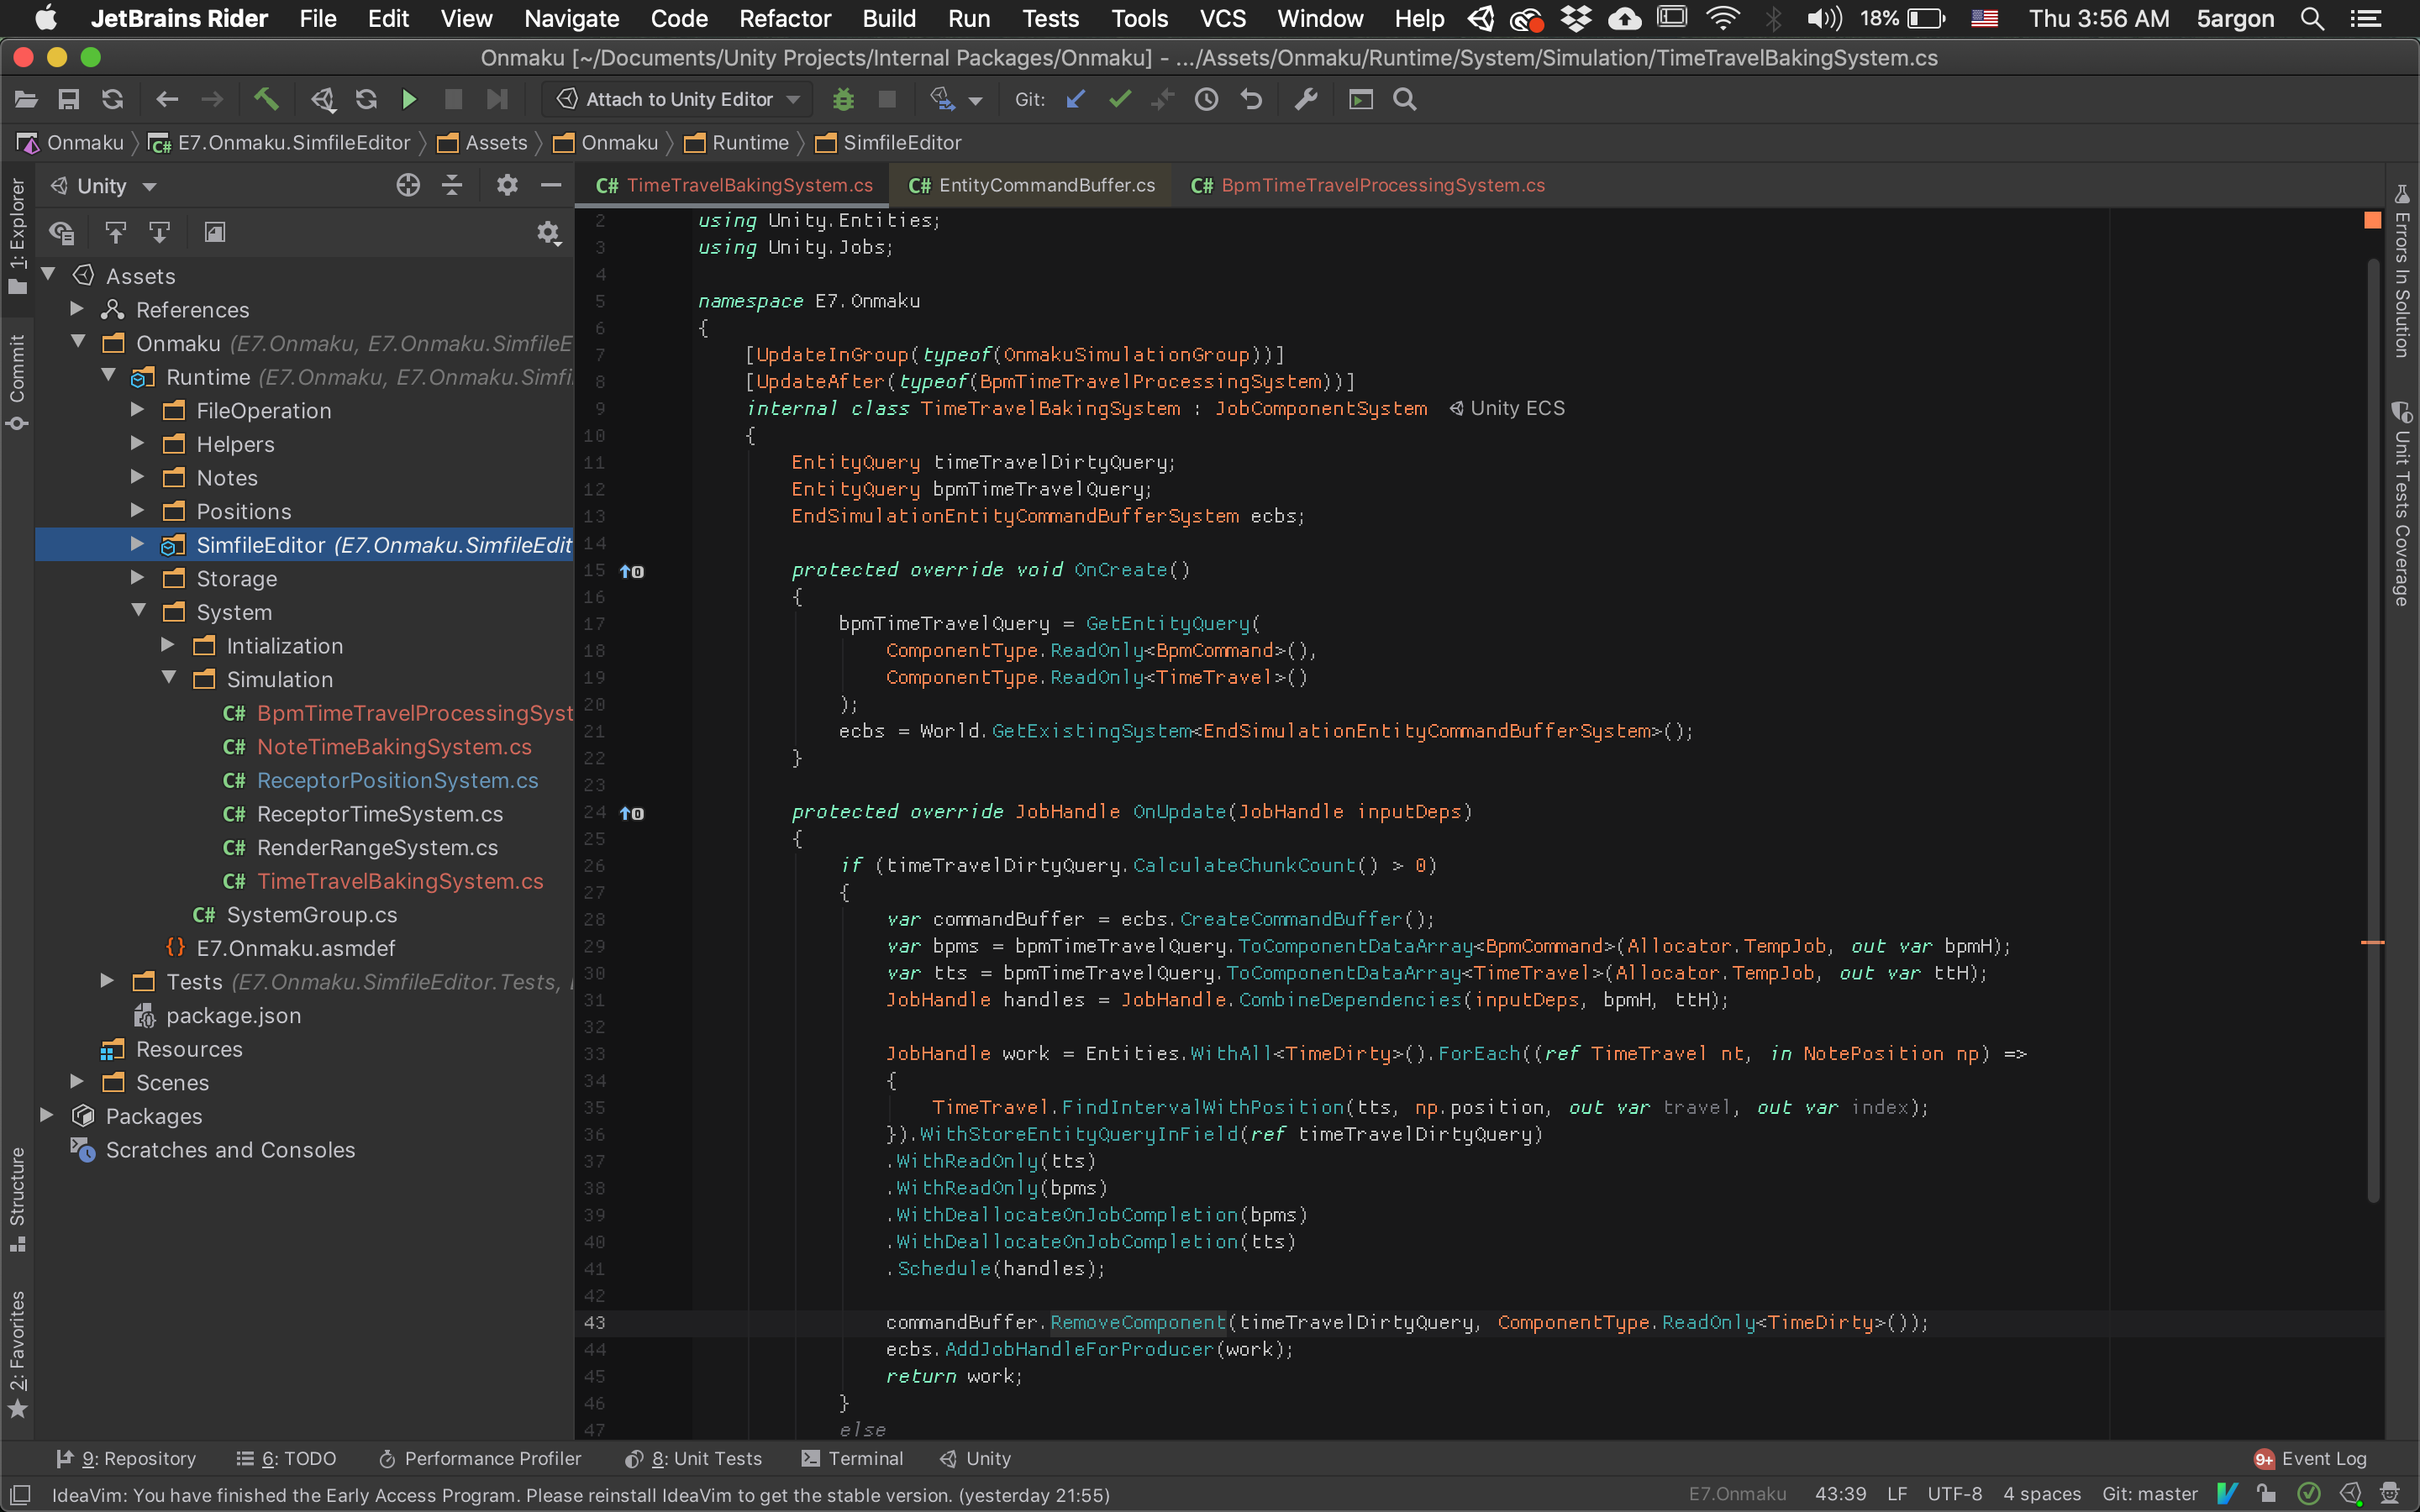
Rider is winning here, because it knows about Unity UPM packages. If you follow into EntityCommandBuffer.RemoveComponent for example :
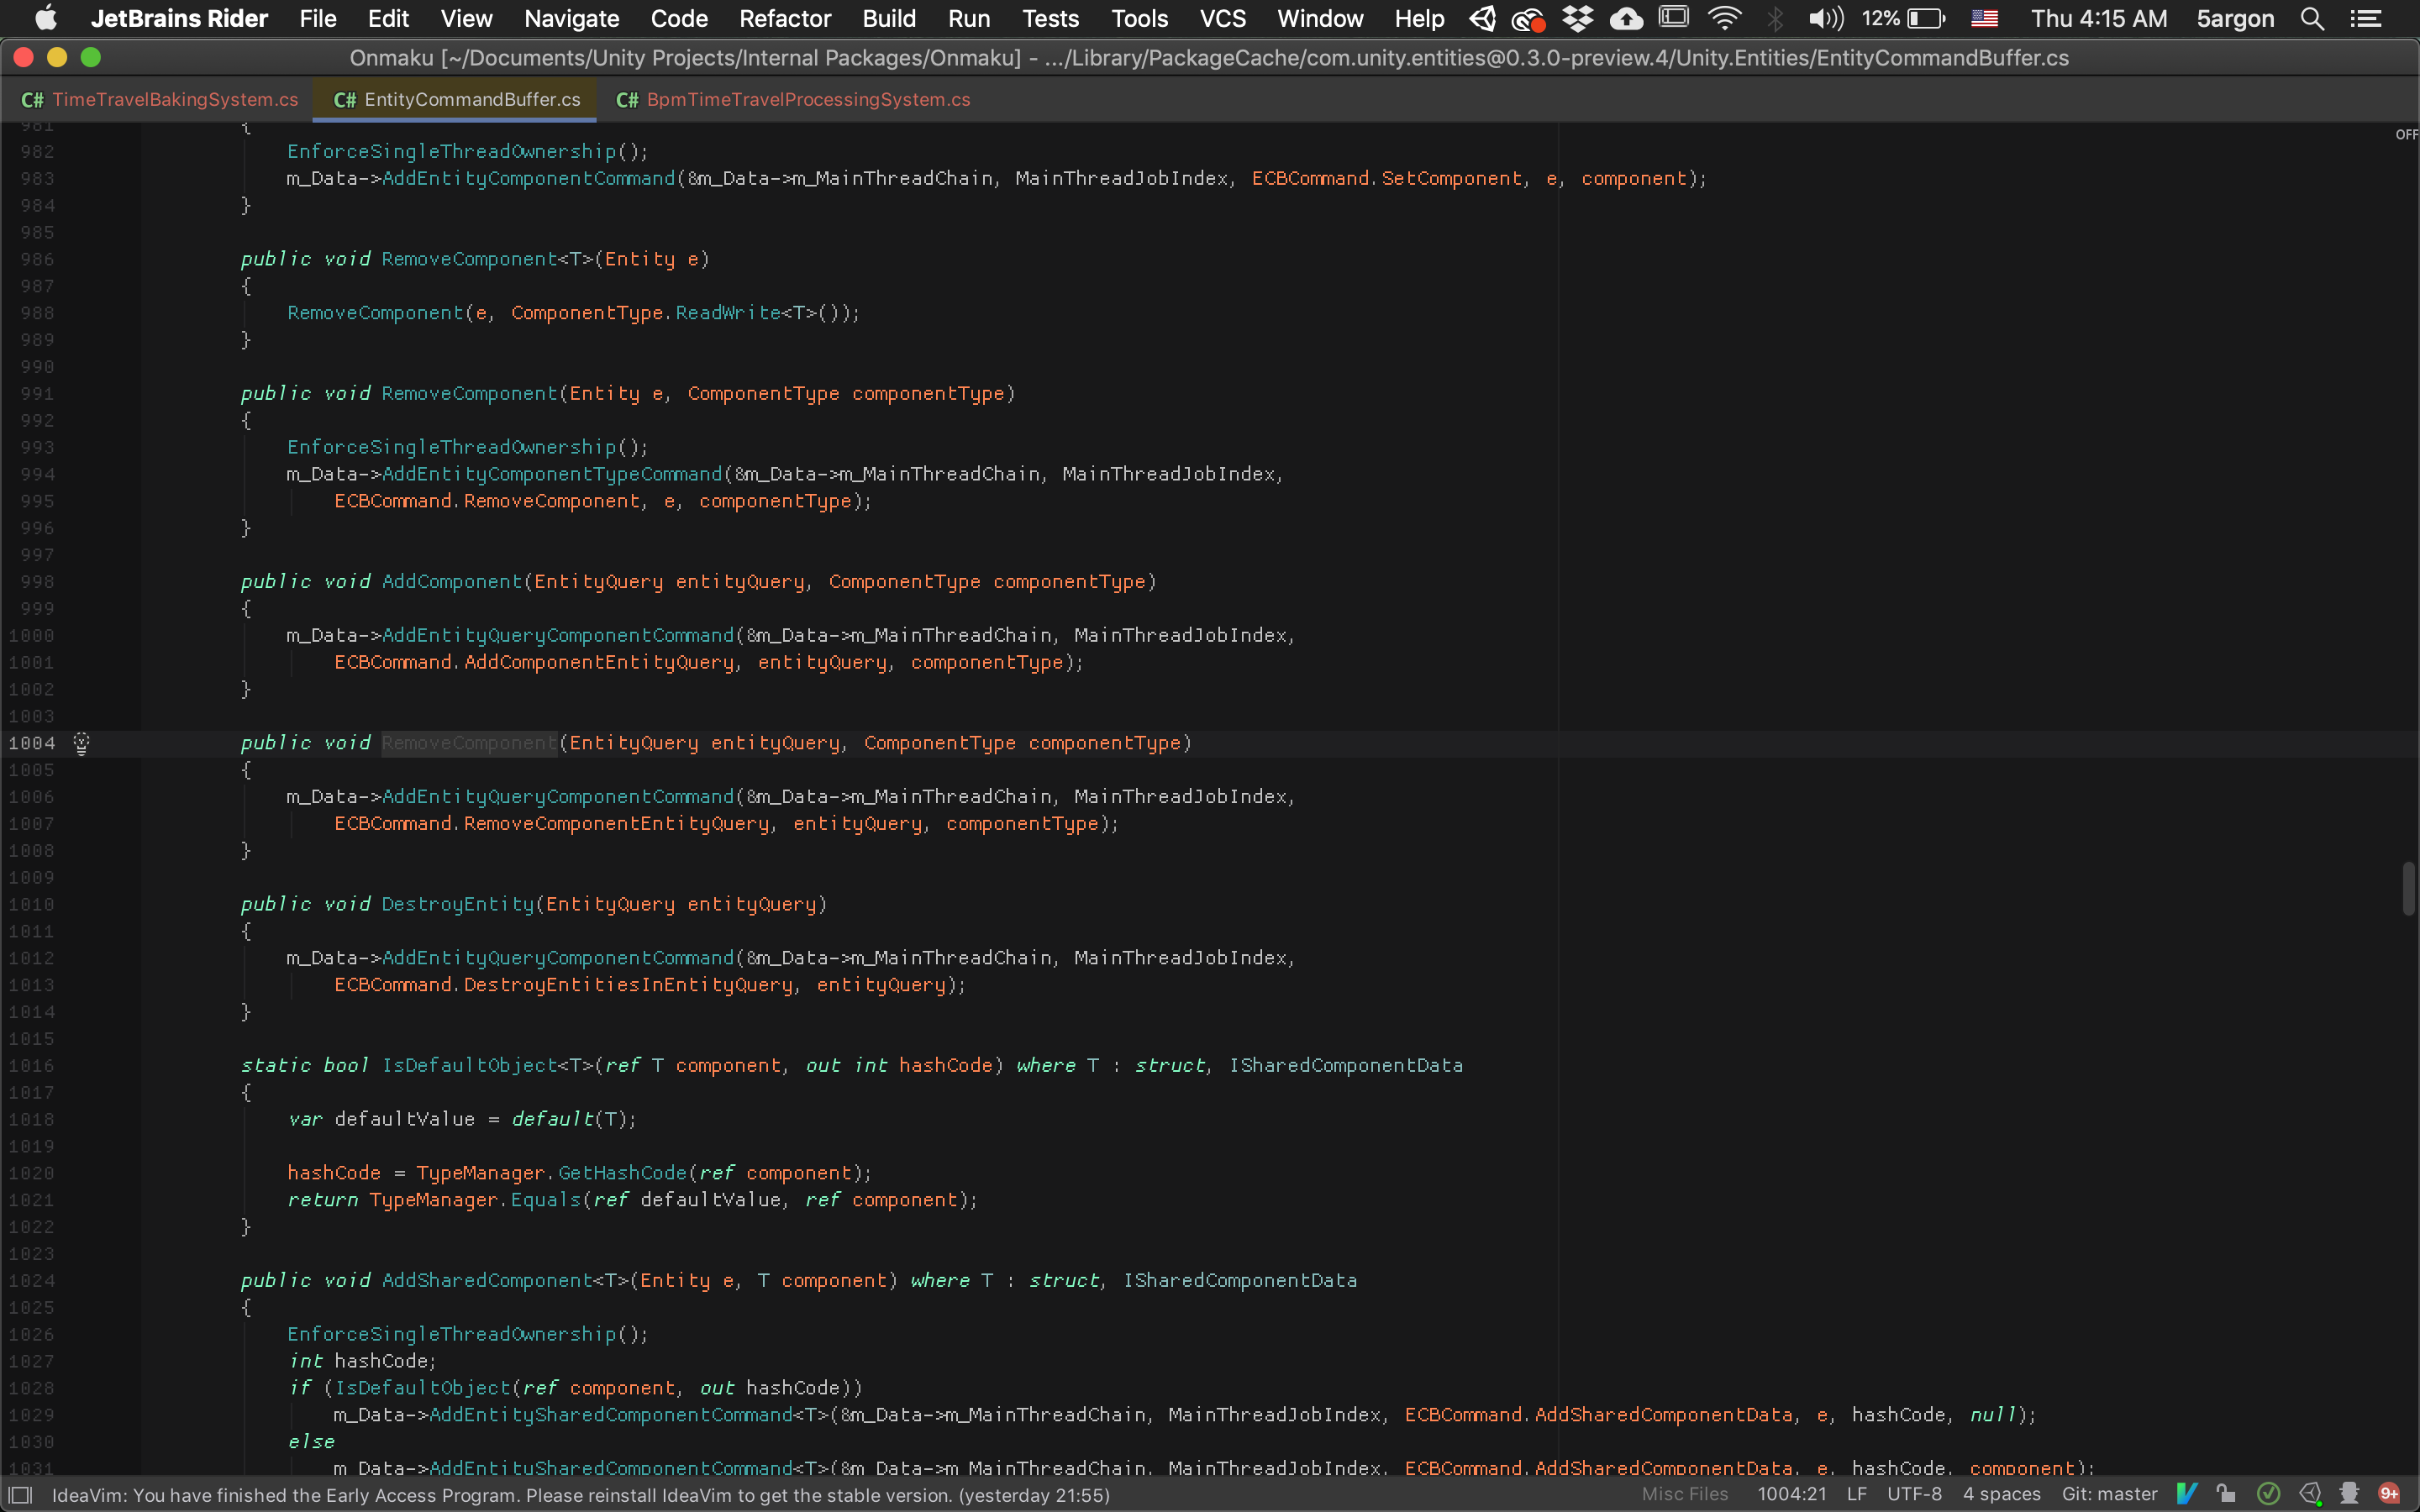
You can get into the package with Rider. This is very important in modern Unity as source code are all available. You no longer have to wonder what happen inside when you can just gd into it then out quickly with Ctrl+O. (Vim commands) It is possible to turn off all the documentation popup with this. I think it is better as popups are distracting, let the code completion box be the only one.
(Though the VSCode dll version one is useful to quickly see the neighboring overloads such as which one has EntityQuery overload, though you can use the outliner in Rider too.)
Peeking
Red hot in Rider 2019.3, you can do this to peek the definition :
VSCode could do it from long ago. Personally I like the VSCode one better because it works well with its "boundless design" by filling horizontally. Also..
Matching find usages behaviour
That peeking UX is very well used in find usages. Now the part at right has a browsable list.
I don't like this massive tree of usage result that Rider presents me. It's clunky, and I can't see the code immediately like in VSCode while retaining old context.
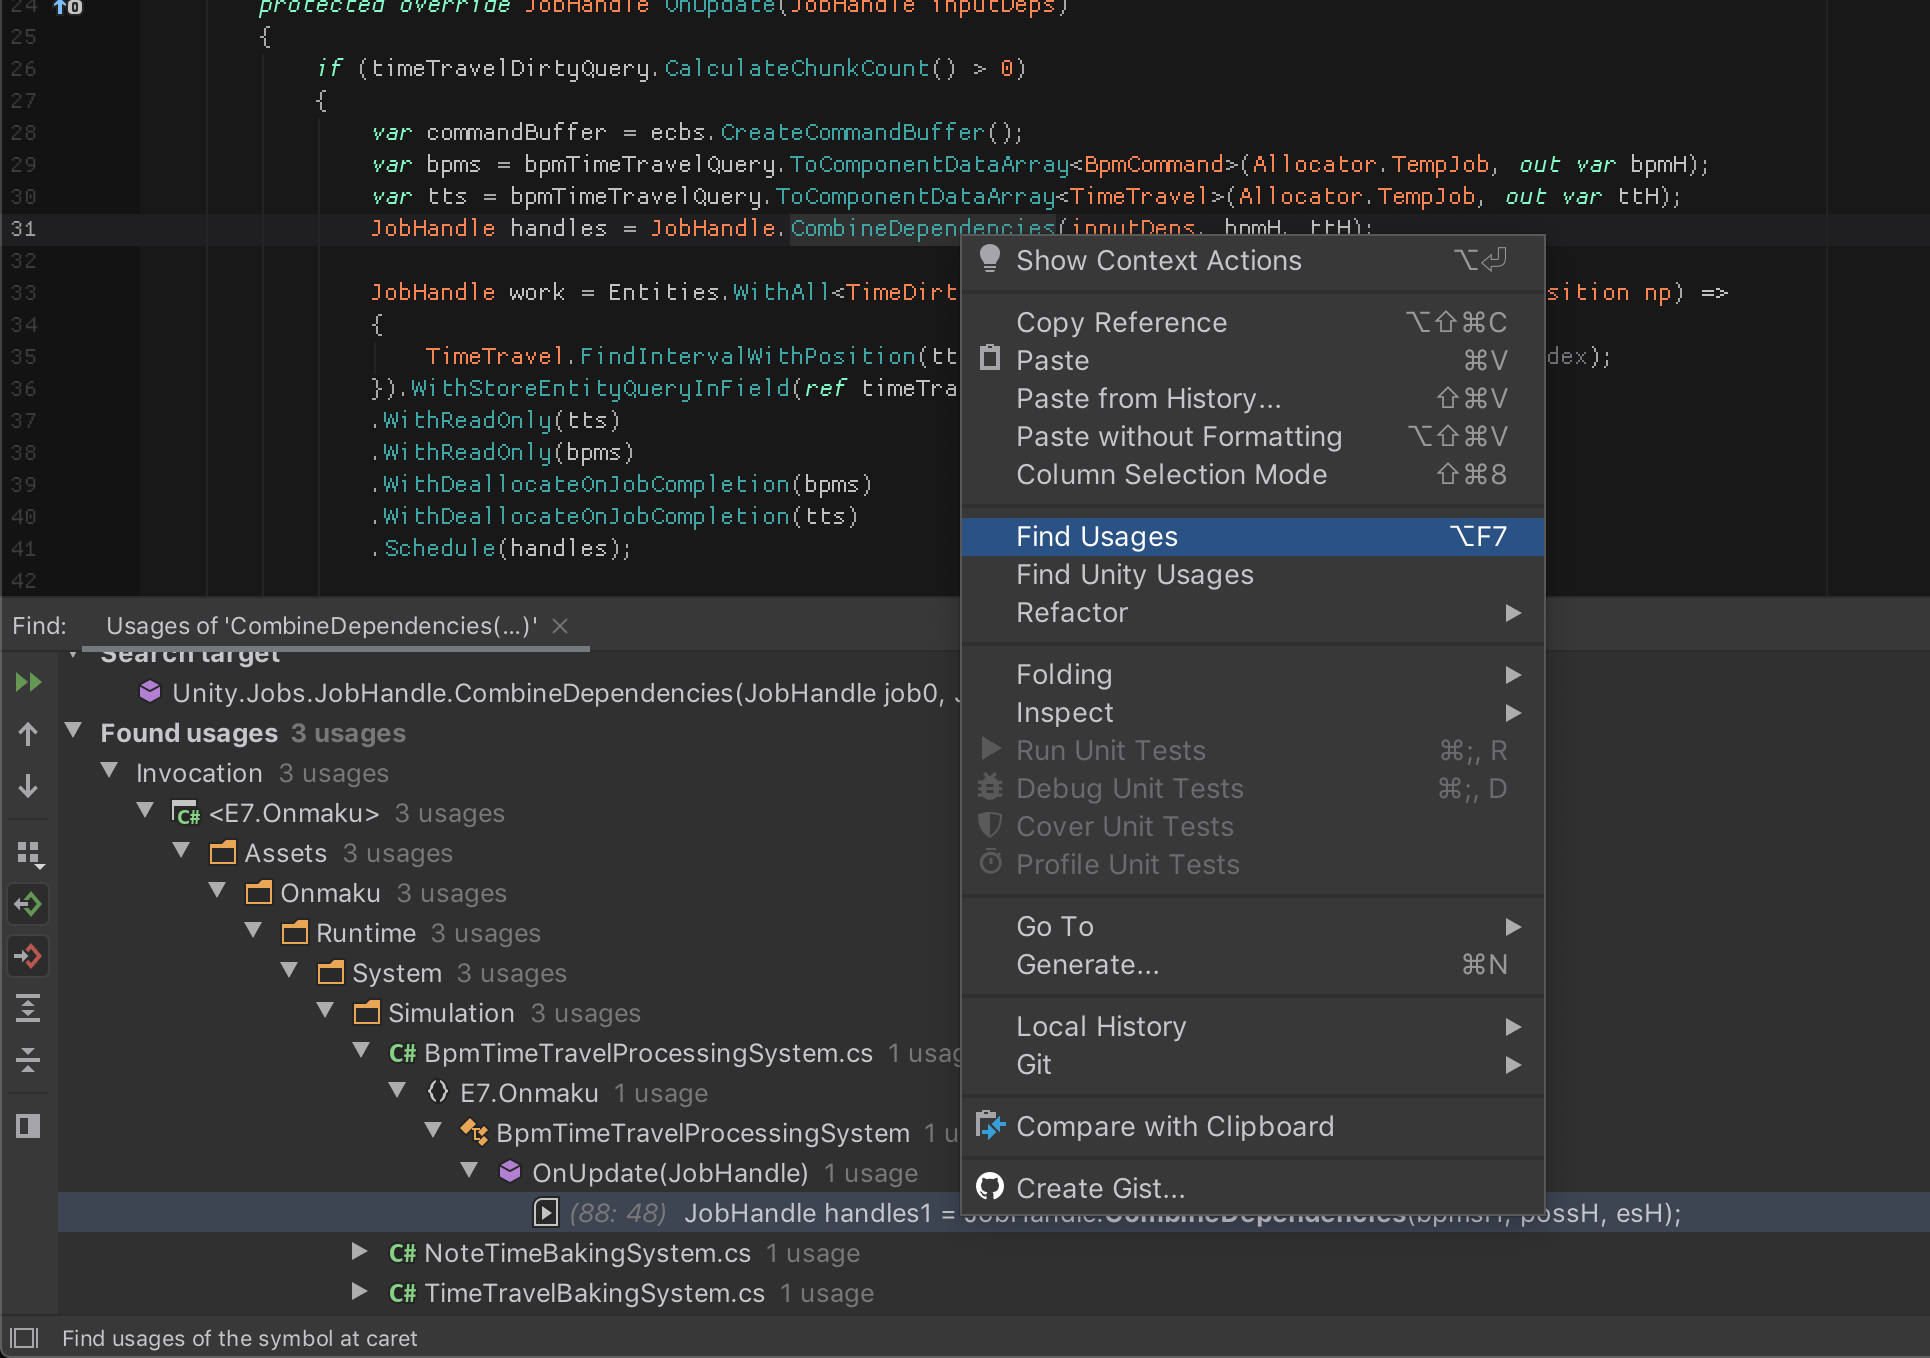
VSCode later even improve by adding a more complete version of find usages, which is still better than Rider's presentation. Just a file and lines where that appears. No need to present me a tree.
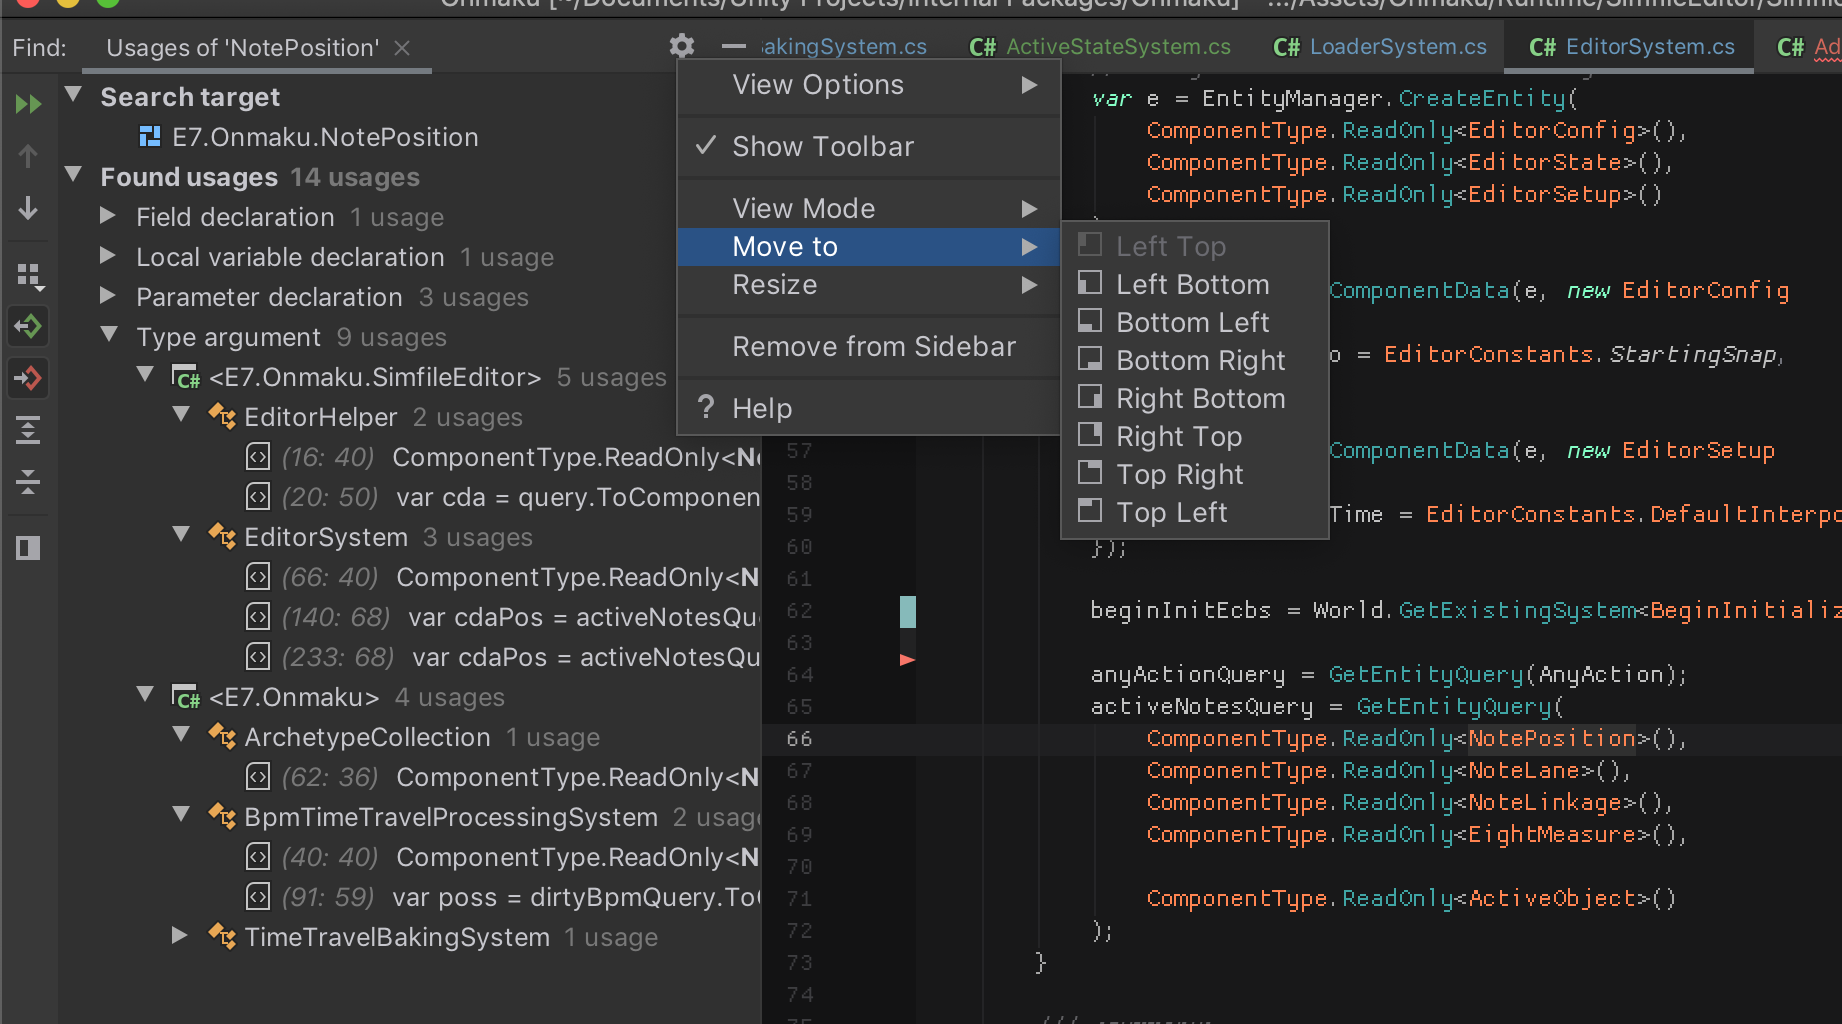
Luckily there is a way to match Rider to this look. First, click the cog and select Left Top.
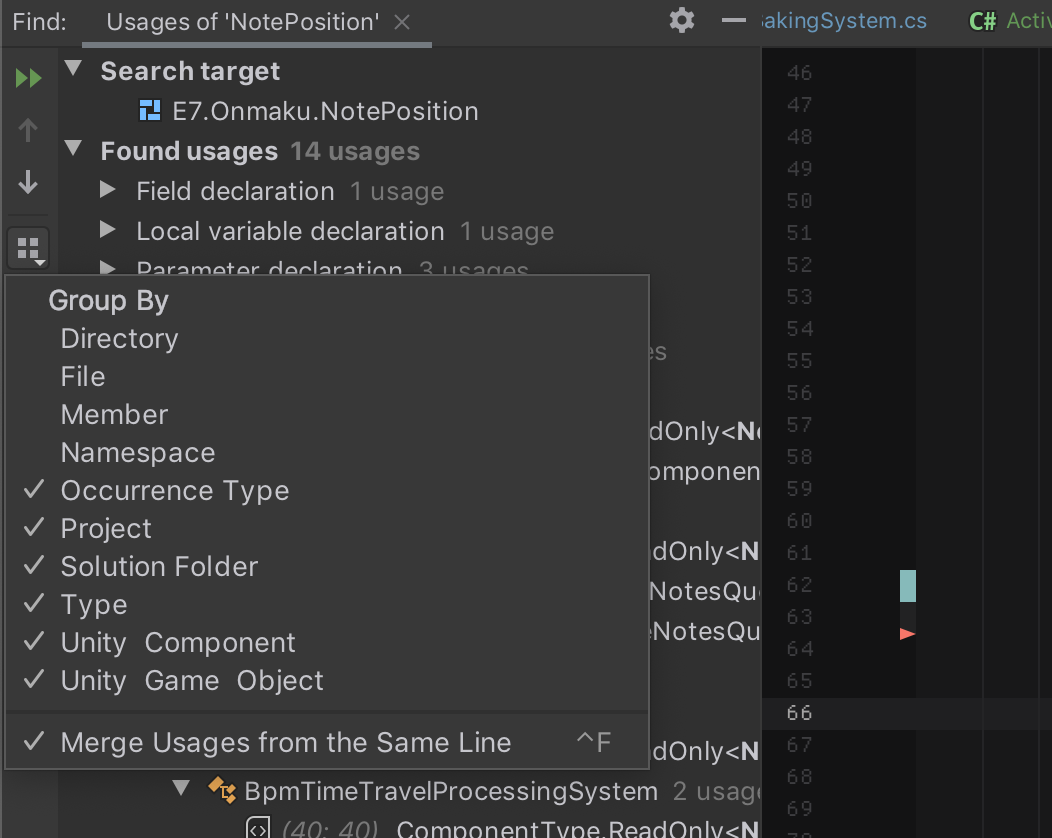
And to eliminate useless folder entries on the tree and make it simpler like VSCode, it's in this Group By menu. Uncheck things from top until it is useful for you.
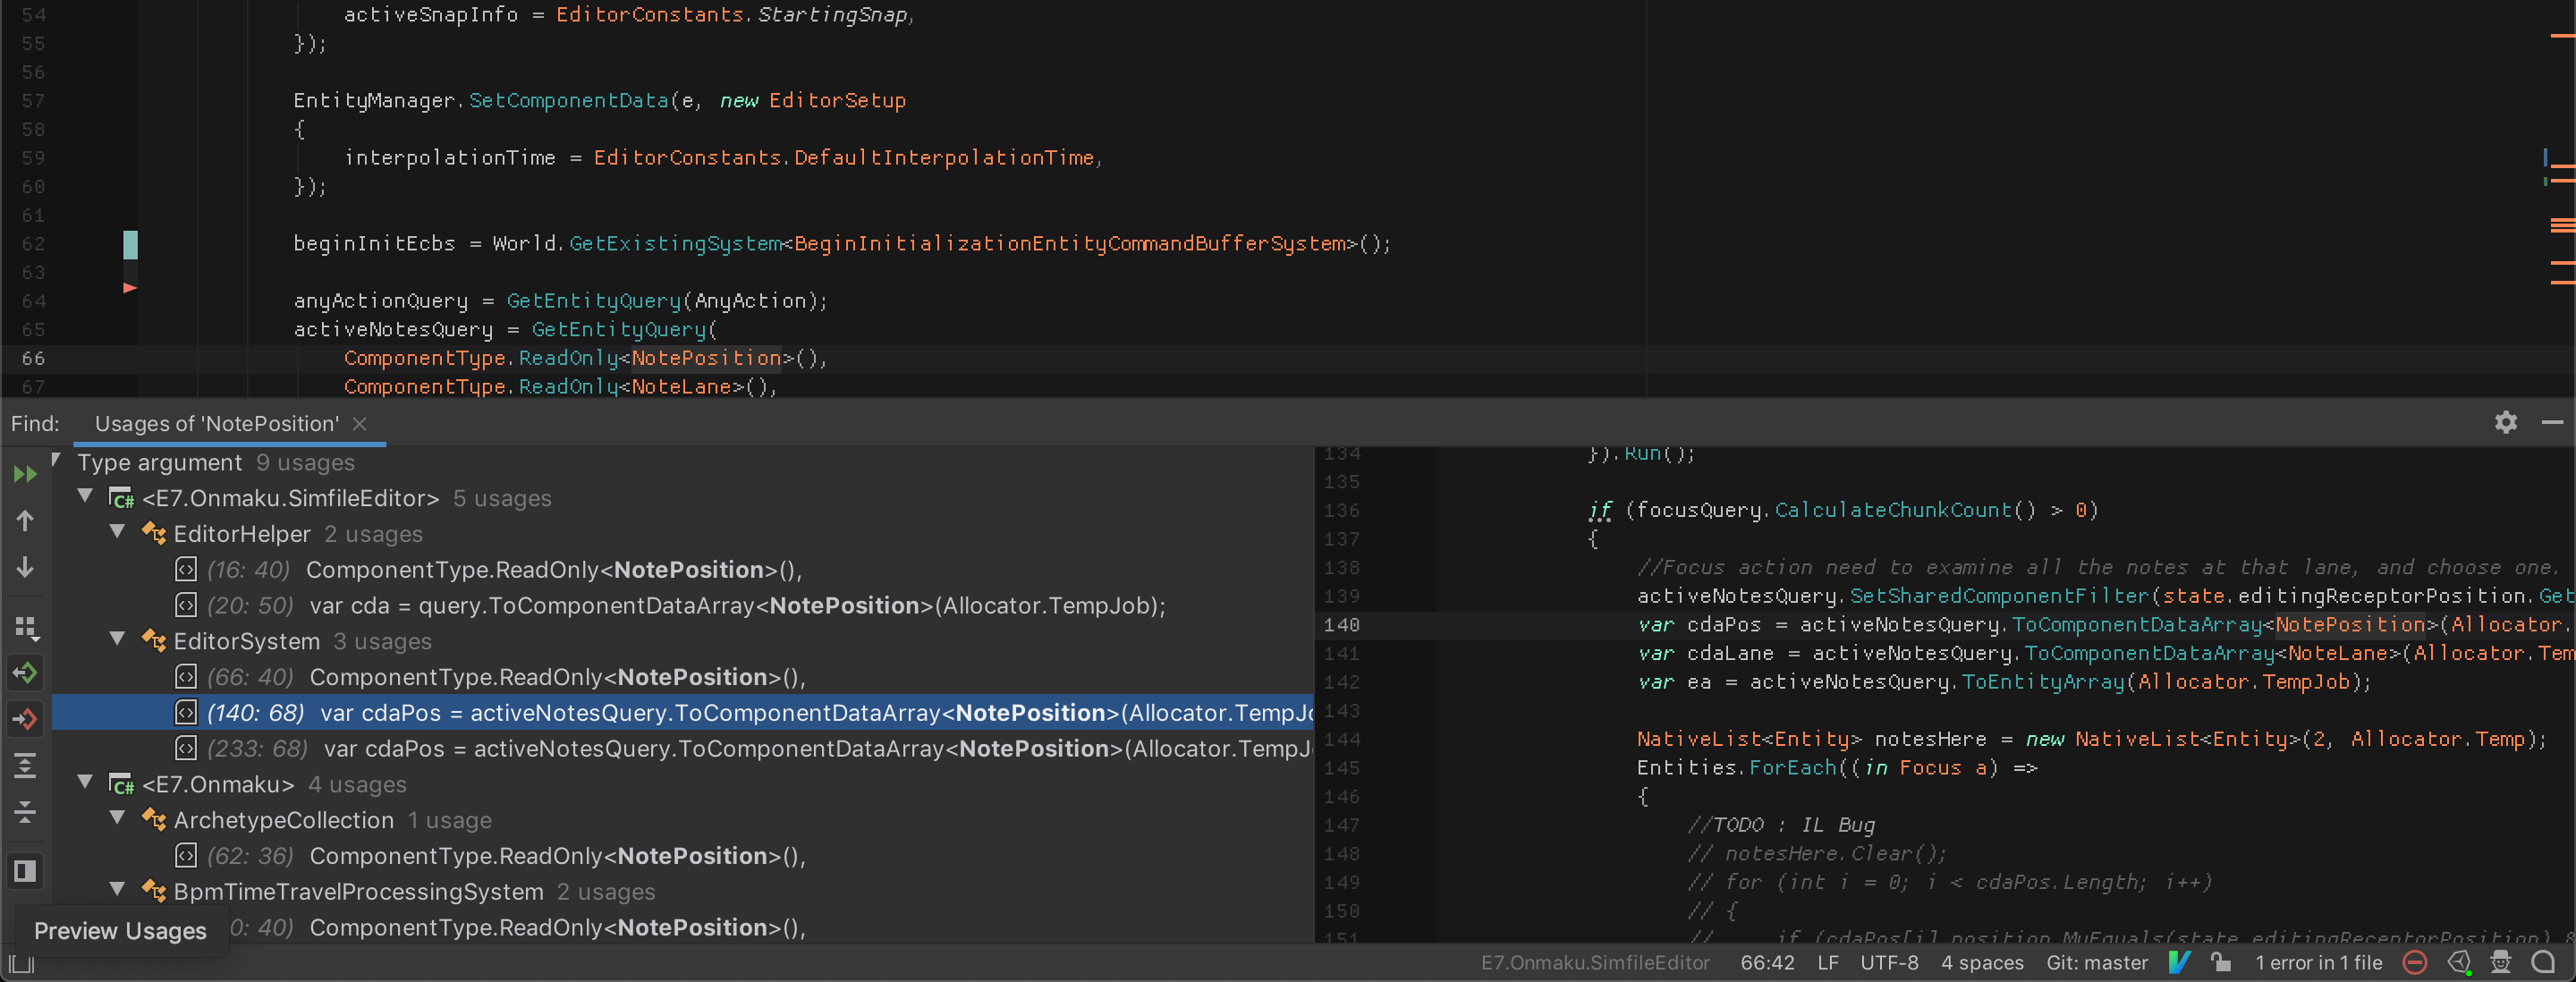
If you like the peek style in VSCode, move to Bottom Left again and select the bottom left corner button "Preview Usages".
The VSCode one again for comparison. It is just that the code is on the opposite side.
Matching file browser behaviour
Click this not so descriptive "Always Select Opened File" button with down arrow so it works like VSCode. When you use Search Anything, the browser then focus on that file. I prefer this more than breadcrumb at top (which I turned off) because I could see the surrounding contexes and I could eliminate the height of top bar to just the tabs like in VSCode.
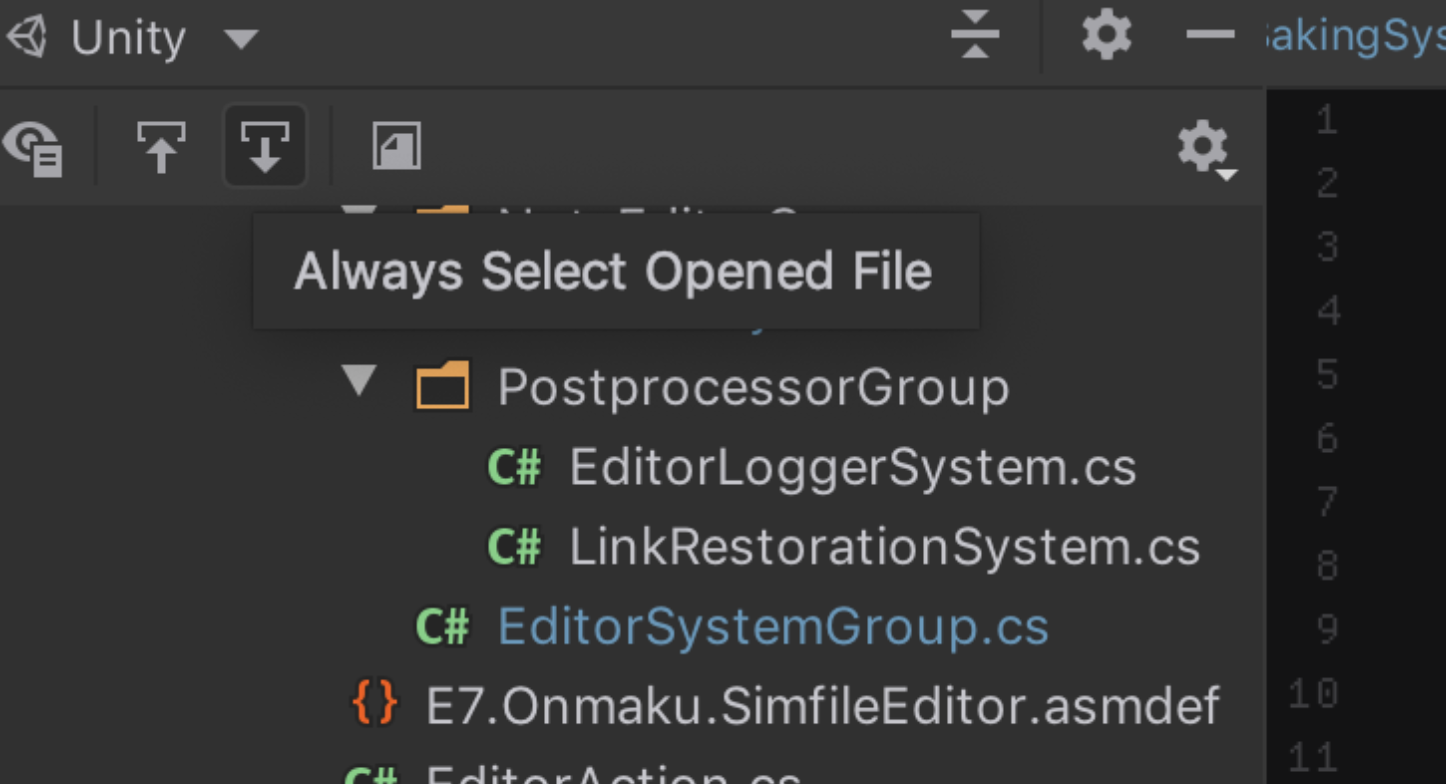
That button on the left with opposite side of arrow, make it so a single click open the file like in VSCode. (The icon looks equally no so descriptive..)
Rename refactoring
In VSCode it is deceptively simple, but feature complete. On pressing F2, there is a little box where if you type something else it updates the entire project such that there is no error. (If the name didn't conflict.) And it is fast!
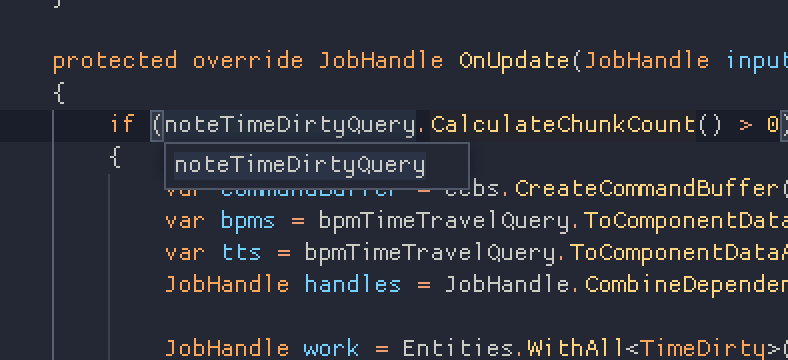
Rider is not only slower as it is more careful to update an entire web of project, and also comments, but I don't know why sometimes it gives a dialog box. (And this version is quite slow.)
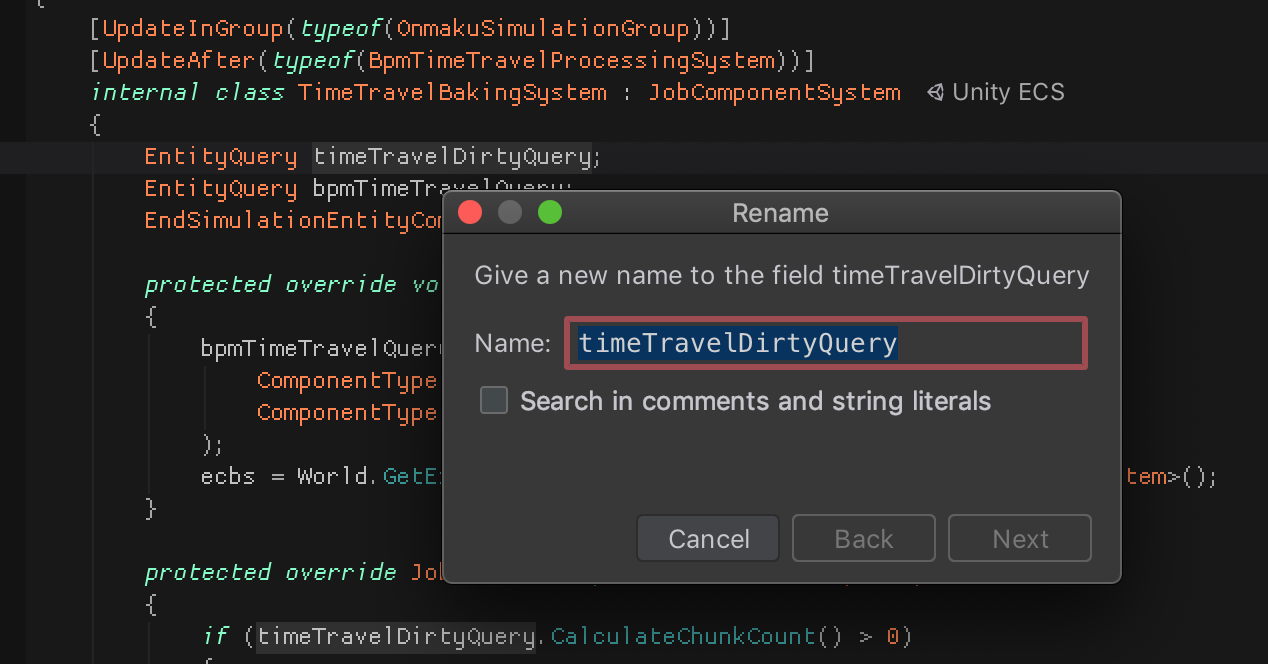
Sometimes the same shortcut gets me a little box instead (I want this all the time...) I guess it is when it is a local variable?
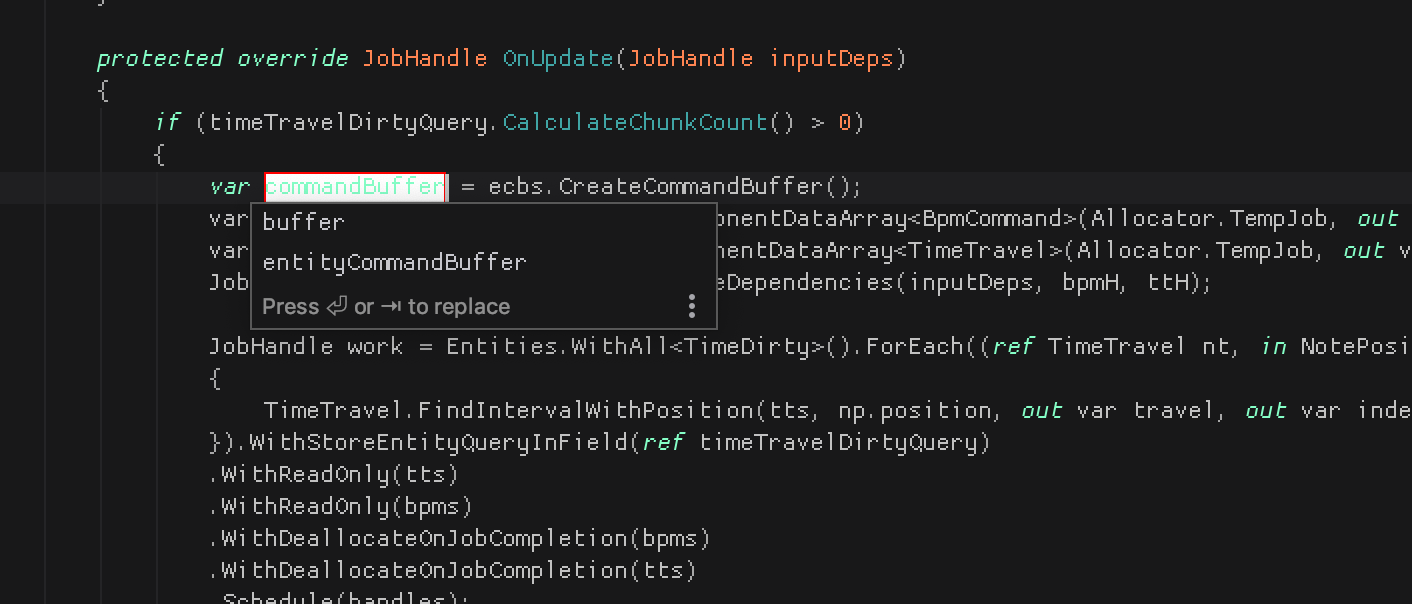
Also I am not a fan of Rider's small box rename that constantly updates the same thing nearby as you type. It seems to be more impressive that way, but I like the way VSCode did that they only commit ripple changes after you press enter.
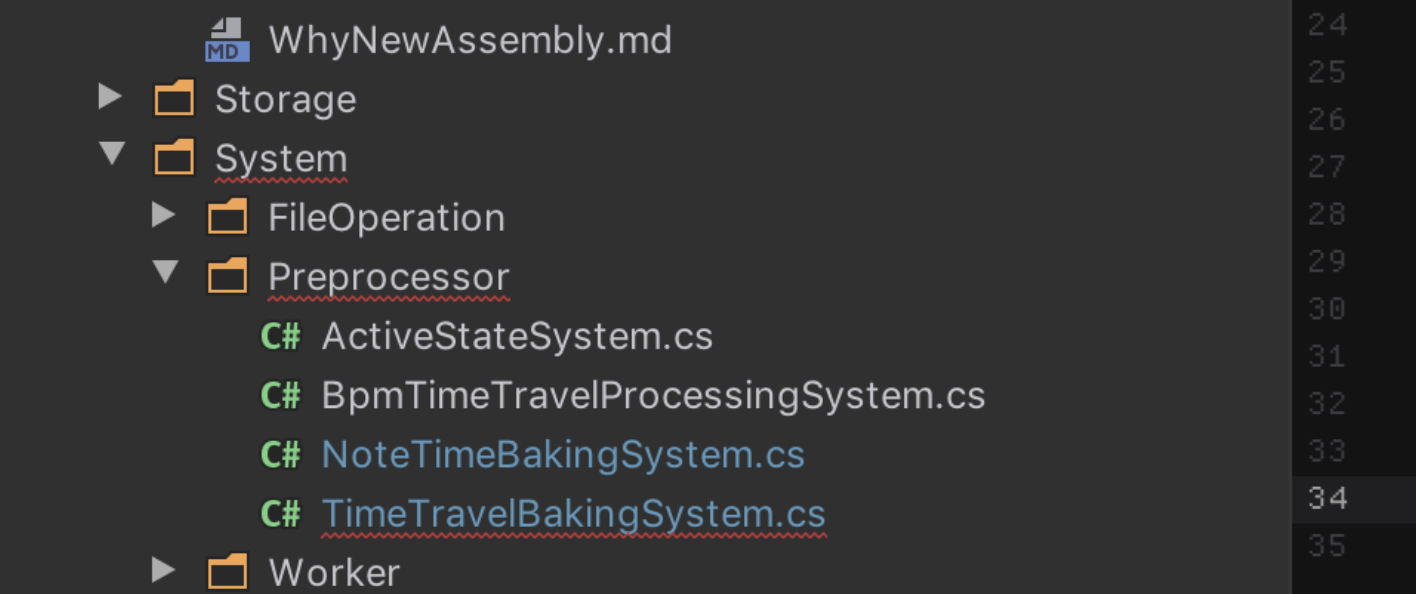
Unity aware project browser
Something I found nice, Rider's looks like Unity's Project panel. The blue box indicates a folder with asmdef inside it. It works with nested asmdef too.
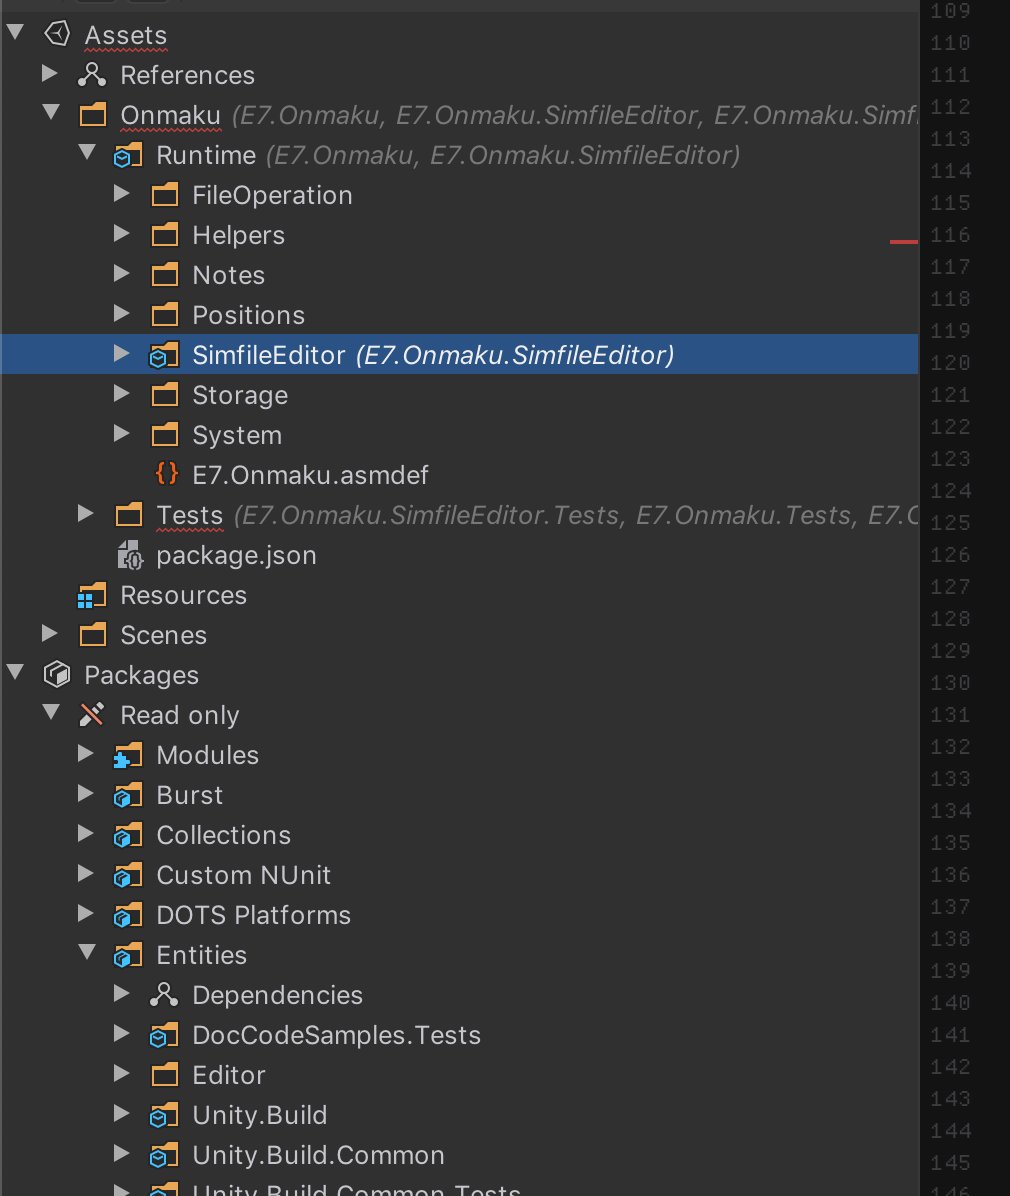
At first I was not a fan of colored icons, but I do look the cartoonish bordered look on them. The shade of yellow they choose is nice, fortunately.
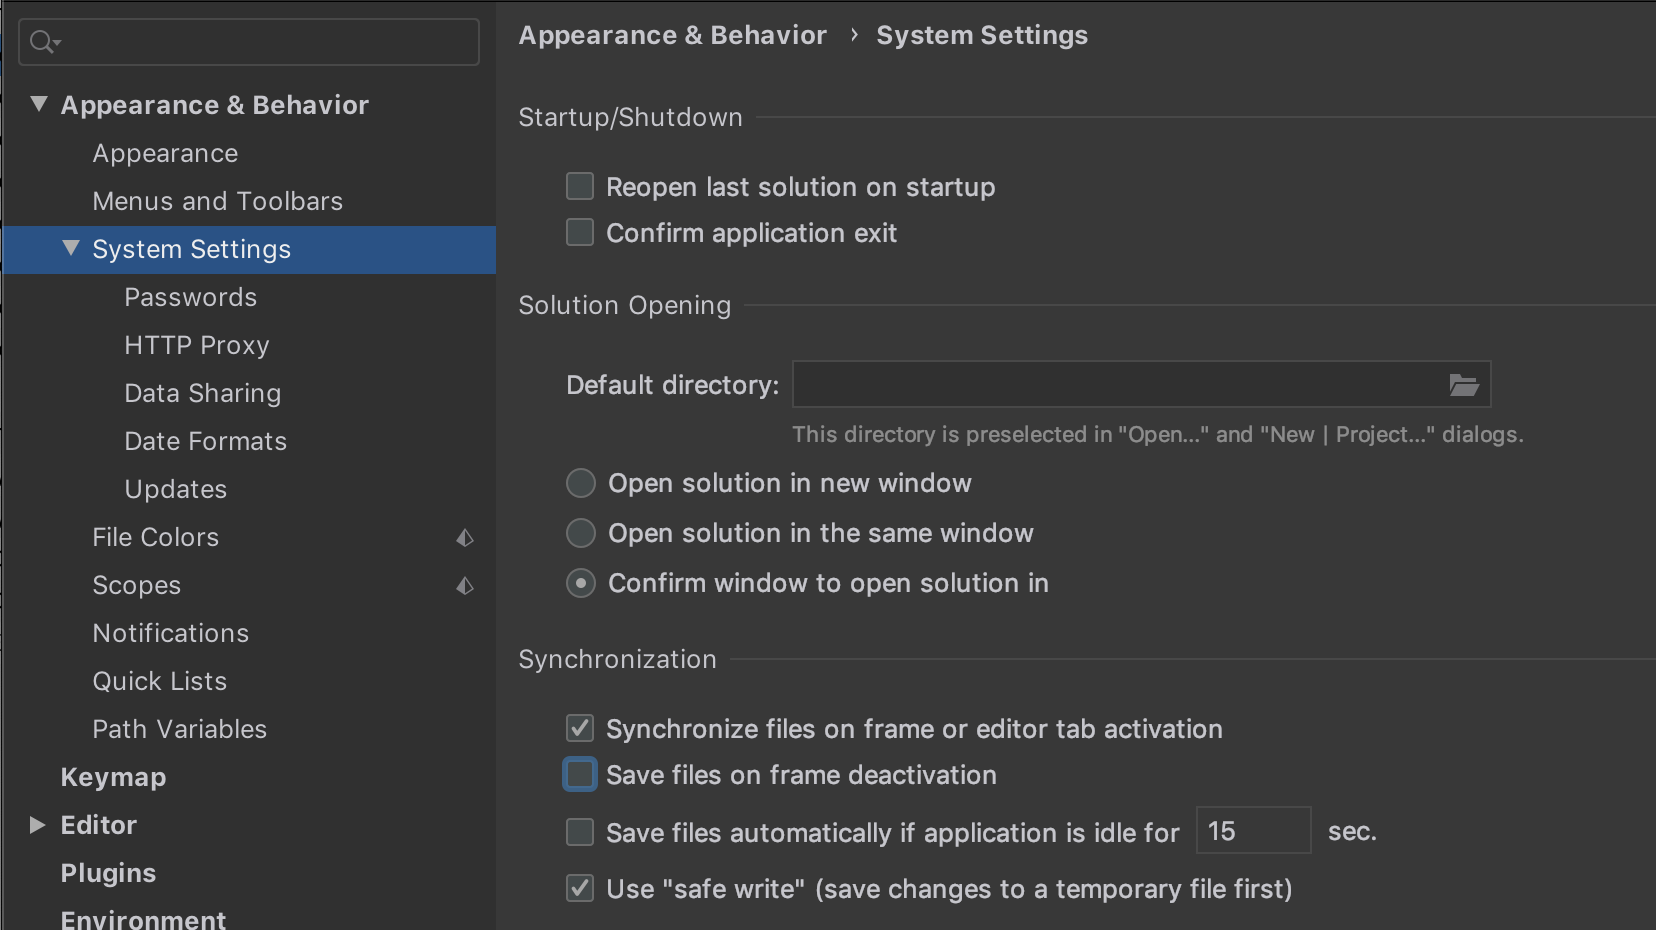
Annoying save behaviour
Rider seems to love to save your file automatically, or do something too transparent that you ended up feeling insecure if it was saved or not. This is hell with Unity where iteration time is a very well known problem.
For instance when you tab back to Unity all files are automatically saved. You cannot left the file in dirty state and go take a look at Unity and come back. You will have to face the 5-10 seconds freeze every damn time. Luckily you can turn this behaviour off :
More weird things you cannot turn off :
- When closing dirty file it will not ask you anything, it will just close it after saving automatically for you. Seems nice, but sometimes I perform stupid edit and wanted to throw those away but now I have to repeatedly press undo. This maybe better if you are more discipline with your version control so you can only revert back to a commit, but it made me feel less in control by removing the save dialog.
- You cannot save a file individually. There is only "save all". This is also weird but in VSCode I always press save all anyways. For me this is welcomed.
Auto-recompile after saving
After fixing the previous annoying point, it turns into a new good feature. Now you can press Save All while in Rider, then you will see Unity reacts and recompile as if you performed the Alt+Tab x2 trick you used to do in VSCode to force Unity to recompile.
I am getting used to this. Usually it goes like : I am done with a section of code and press save manually. I spend time glaring at it for a few seconds, then think "Ok double checked. Nothing wrong!". But by the time I finished checking, Unity has done compiling my new code since it triggers as soon as I press save. It now feels like tabbing back to Unity is instantaneous.
If Unity managed to fix their iteration time to be under 500ms in the future, this will be even more beneficial.
You can limit tab count
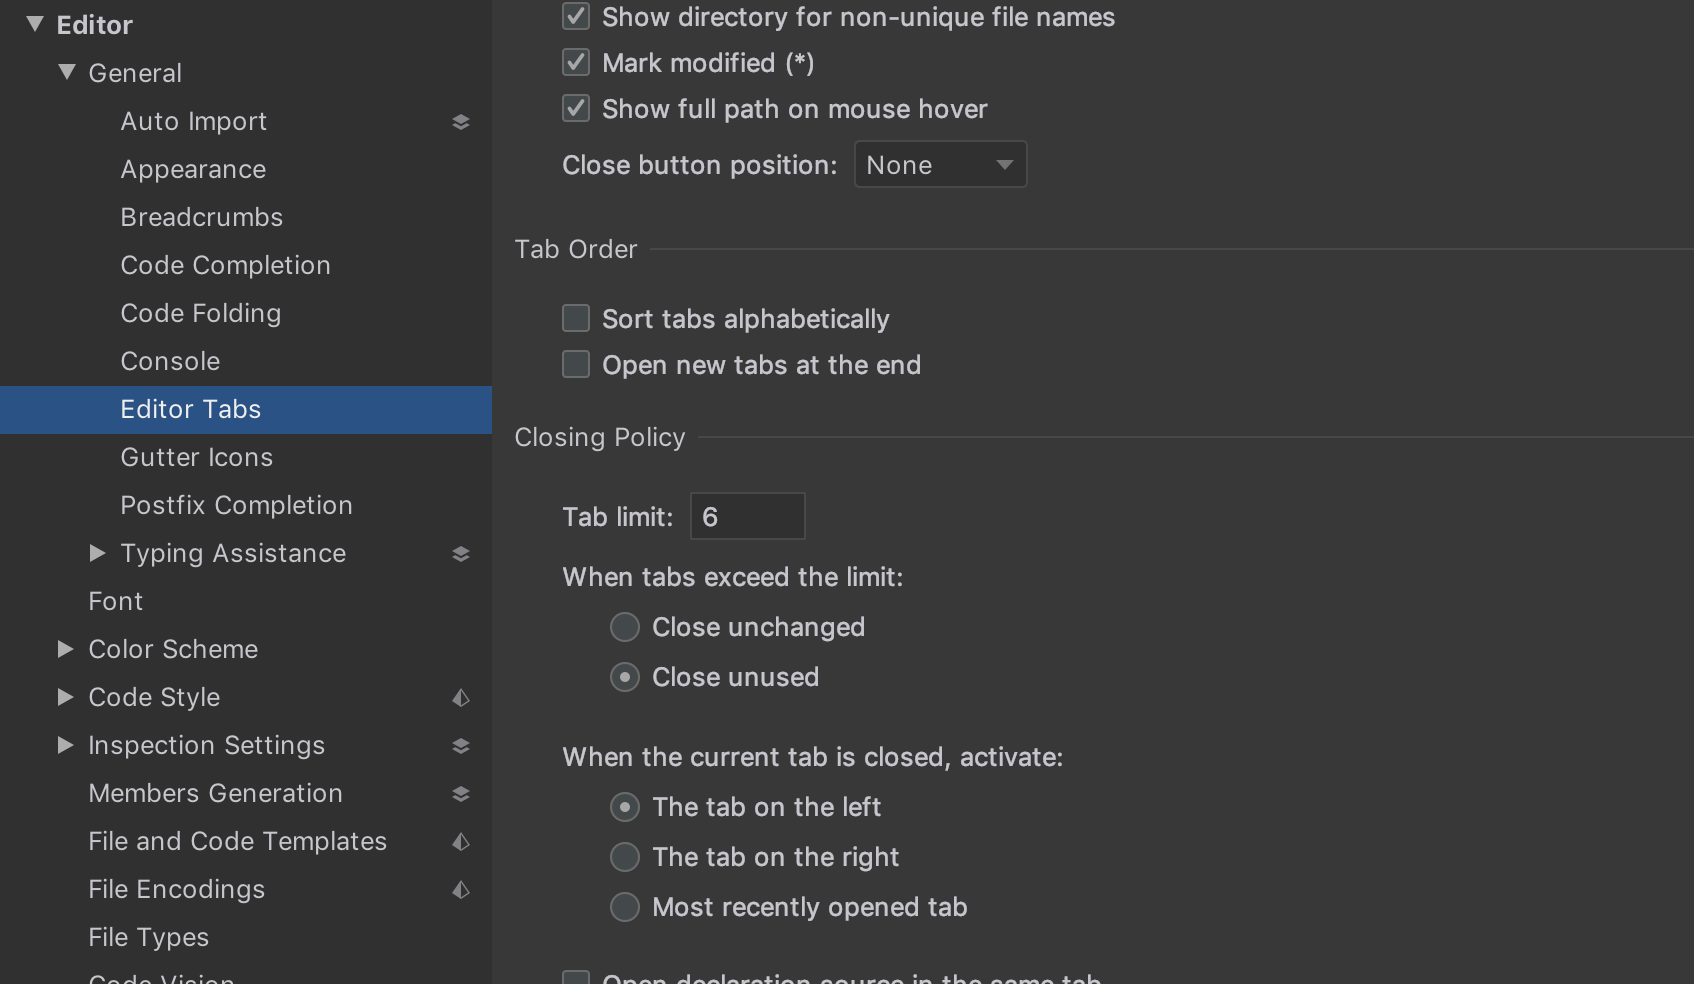
As you follow definition and open many files you ended up with a lot of tabs. I like this option that automatically close tabs for me. Though, it is a bit annoying when it close an unsaved tab and while it did save, it triggers Unity recompilation making my machine lags a bit.
Perform file operations as you like
VSCode at least have mass-rename or separate class to a new file, where it talks properly with Omnisharp and maintain its sanity. However there are limits. You cannot just new C# file or rename it in project panel in VSCode and have that file works flawlessly until you Alt+Tab 2 times to Unity and back forcing it to recompile, include the file in the C# project, then finally Omnisharp kind of "restart" and know what to do.
As expect of a more IDE-like Rider, you can new file and move file around as much as you like without switching to Unity and ReSharper still works. This is quite huge as in Unity these operation causes a spinning compile wheel of doom, followed by one long freeze before and after. It maybe well over half a minute each time.
Also you could do it all while the file is unsaved (dirty). VSCode Omnisharp often fail randomly in on some refactor commands if you didn't save the file or sometimes, wait for the resulting compile to finish first . I noticed that Rider never fails. Splitting files, symbol renames, dragging the files to other folders like crazy, while unsaved. It always work!
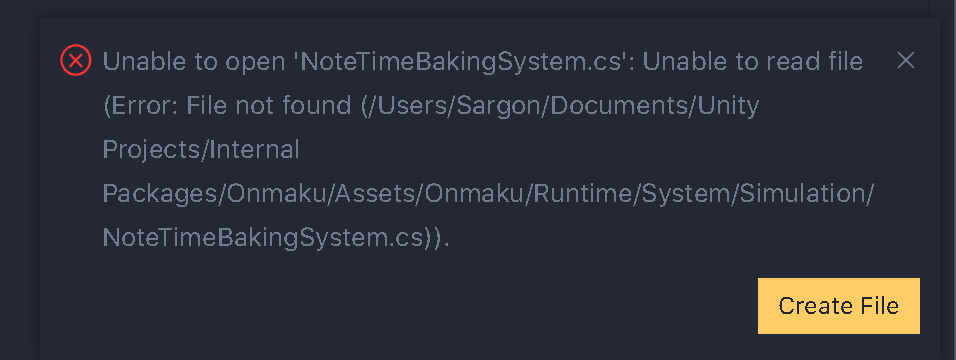
Here's what usually happen when you delete just 1 file in VSCode's Explorer panel. That file is empty because I just refactored things out of it.
How to fix it
And sometimes this doesn't work until you restart the VSCode, with a random combination of restarting Unity or press Open C# Project in Unity after cleaning up all sln and csproj. File operation in VSCode with Omnisharp is just too brittle.
Edit : Something like this wouldn't resolve no matter how you restart Unity or VSCode or Omnisharp, sometimes restarting the computer helps, but I would rather pay then dealing with Omnisharp's tantrum... VSCode is a good editor as long as it doesn't touch Omnisharp.
Recursive error indicator
At first I hate it, but now I love it. When you perform some manual refactoring that automated tools couldn't handle, or even some arbitrary edit, often times you are partly aware that something should break after doing this. Therefore you want to fix those next. Often I don't even want to read the error because I know it gonna error, I want to see where. And the way to do that is to double click follow the error anyways though I don't want to read them.
Usually I have to "Alt+Tab x2" to nudge Unity to recompile and update and produce a new error. But in Rider you see red squiggle appearing recursively to the outer folder what went wrong because of it, without reading the error log. Reading takes time, but you just want to know where quickly and when you see the code you may know what to fix even before reading what the error has to say.
It also applies to place like Search Anything. This is nice as most of the time that is probably the file I want to go.
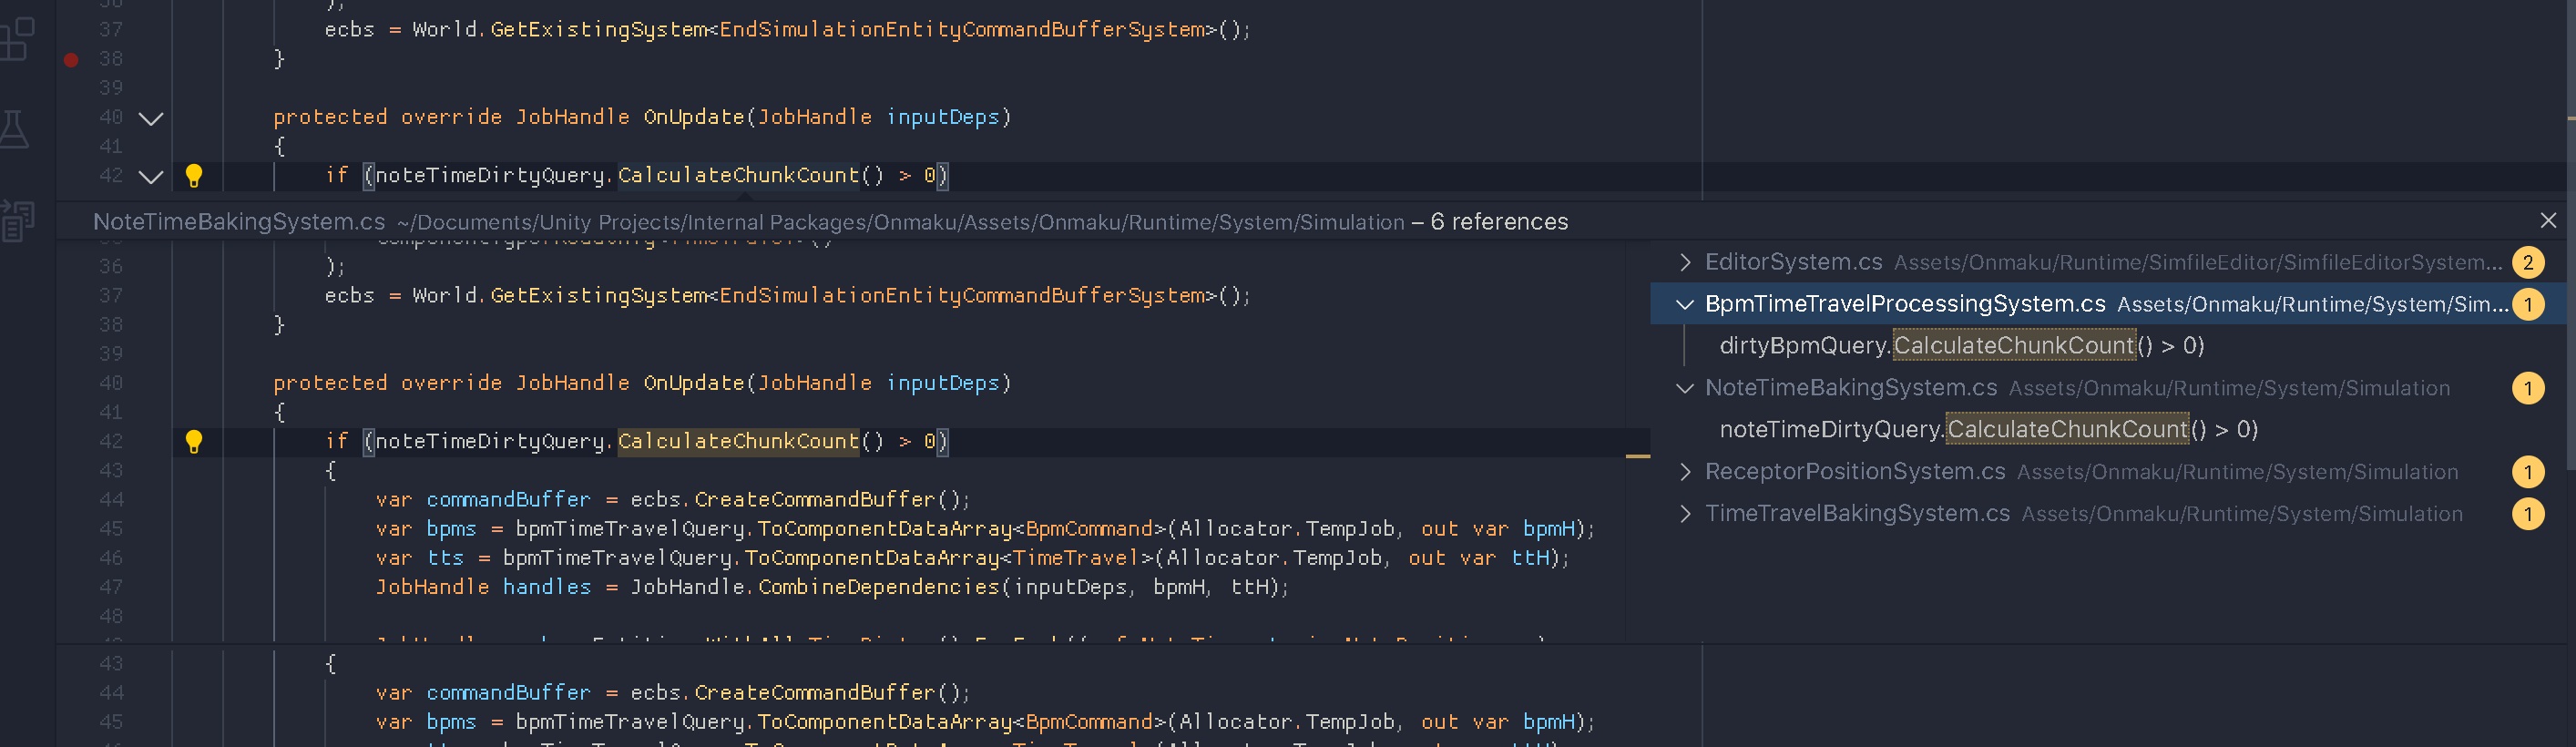
Find usage : Write access
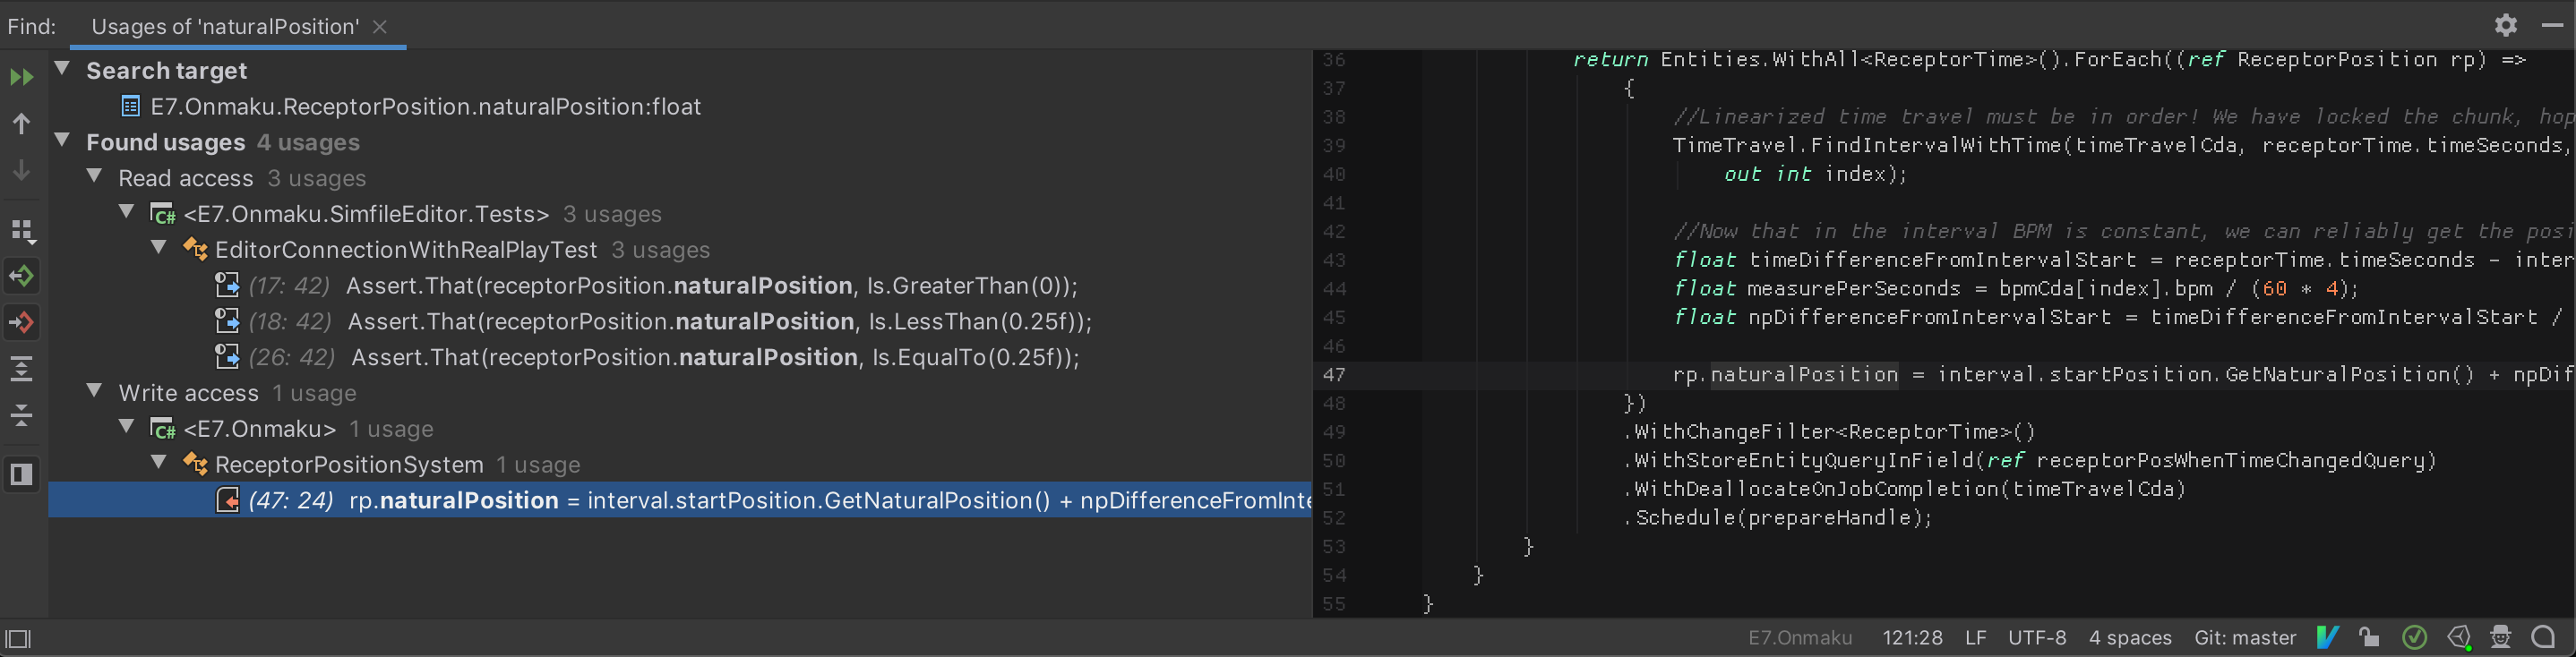
One extremely valuable feature in Rider not in VSCode, is the Find Usages has category based on read or write. Usually the source of problem in your test where you read, is of course to find the places where it was written. I usually have to look for = sign in VSCode manually or include that in a project wide search. This is very convenient.
Unit testing
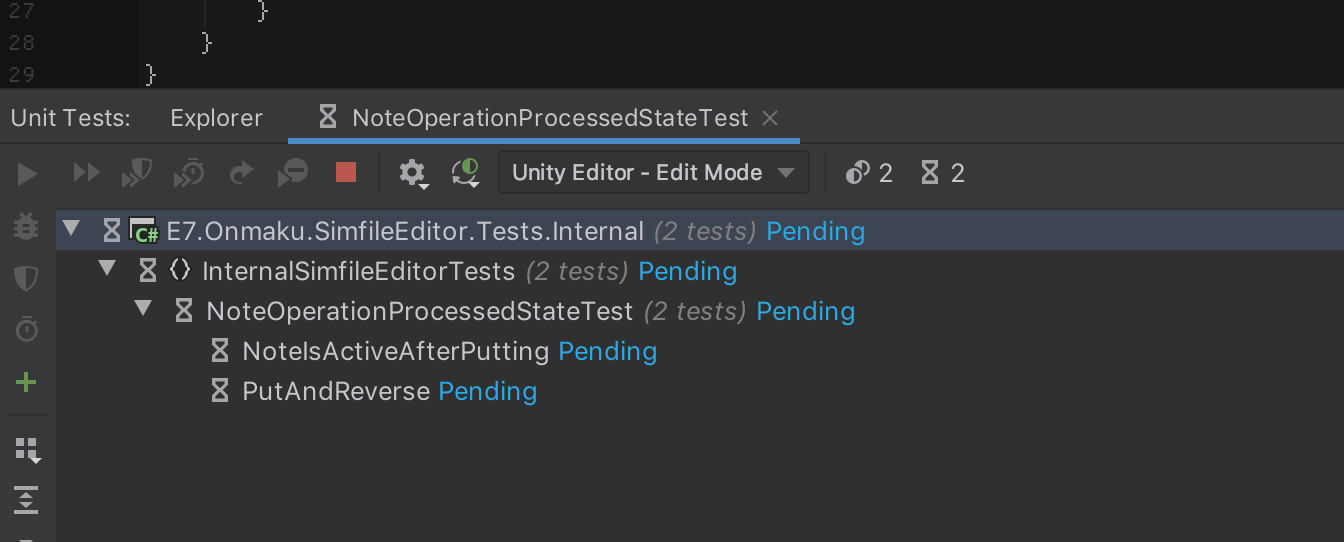
You can run Unity tests from Rider. You can only run pure NUnit test in VSCode.
It seems Rider wins but actually no one wins beccaues it is SO SLOW! I would rather double click the one in Unity. It is so slow I got enough time to casually screenshot the "Pending" state of some unit tests which should be lightning fast.
There is a nice button to click on the left of test method so you can run that test, similar to VSCode but it works with Unity. However, it is SLOW so I would rather Alt+Tab to run it in Unity anyways.
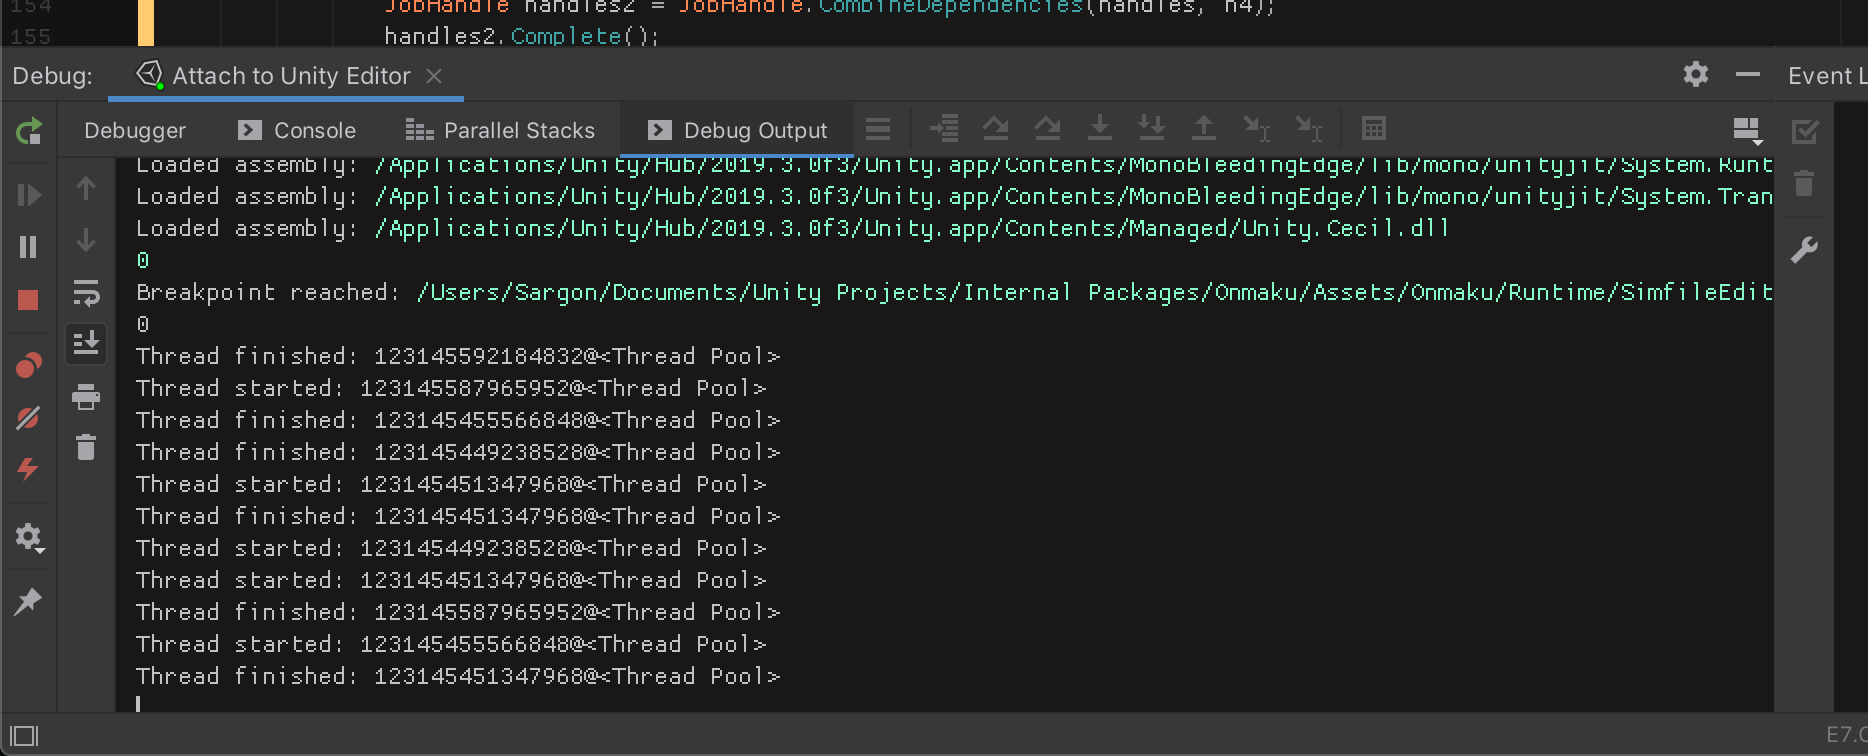
Tracepoint (breakpoint that logs instead of stopping program) didn't link to Unity's Console. Also there is a questionable auto complete in here, the eight you see is a valid log because I overridden ToString of it. However the auto complete randomly suggest things not depending on the current scope.
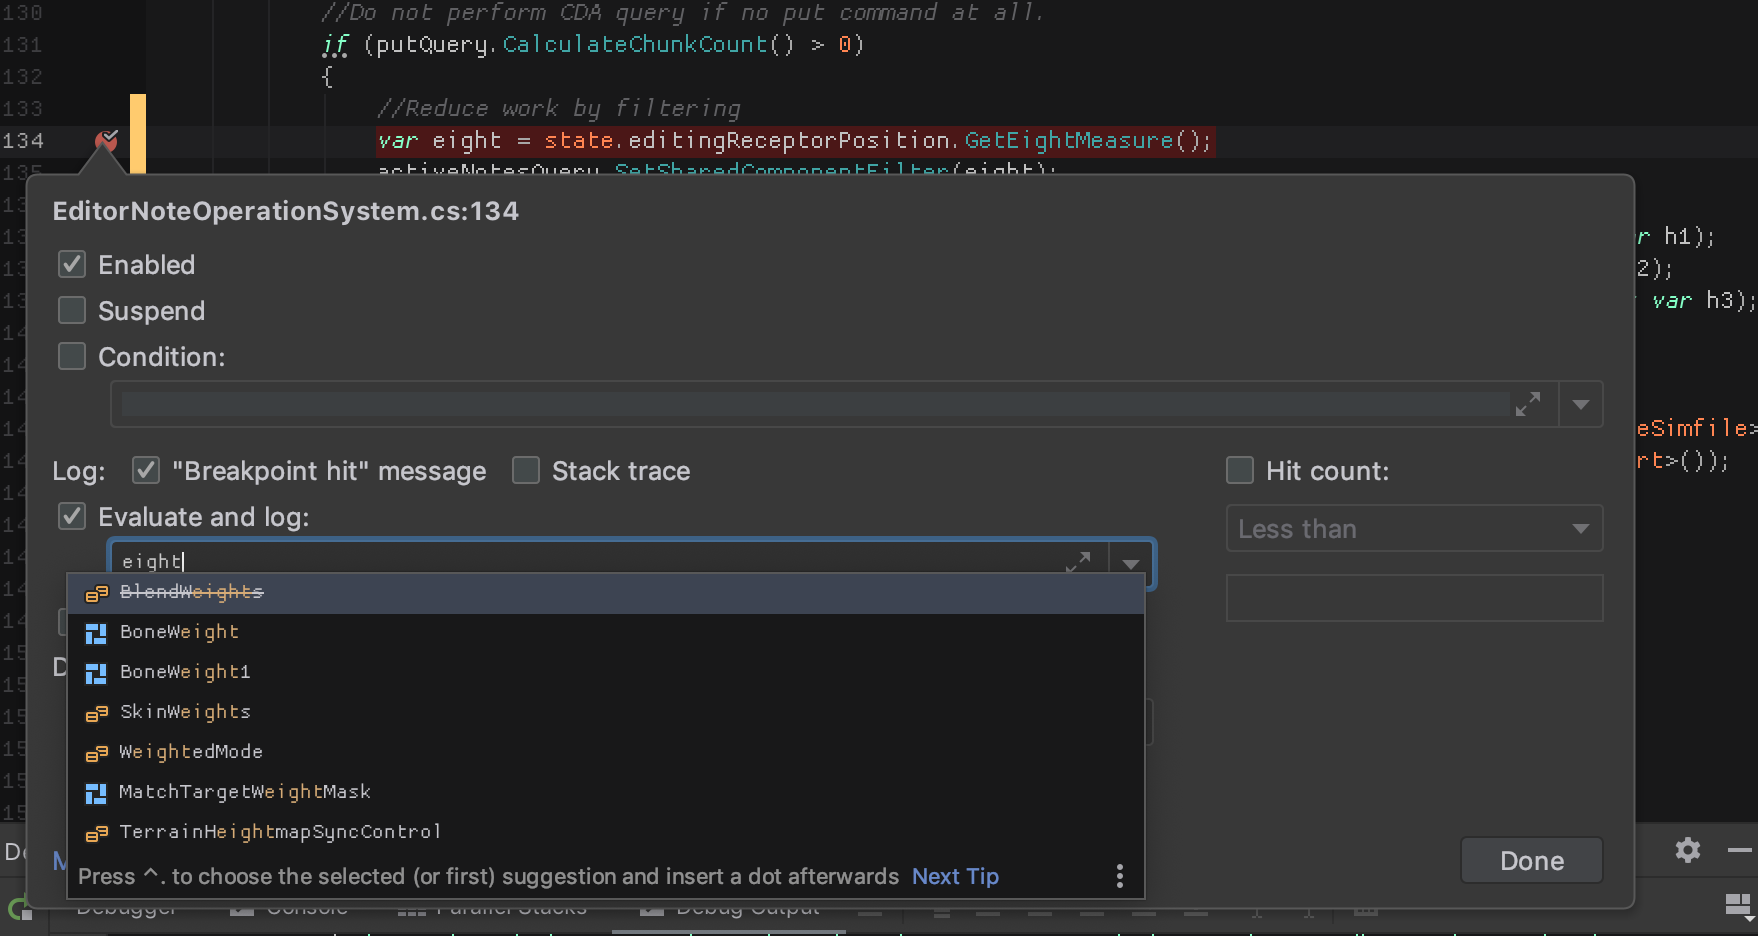
The output appears here in "Debug Output" panel. But it is often flooded with other messages. Ideally I want to see the log in Unity and not here.
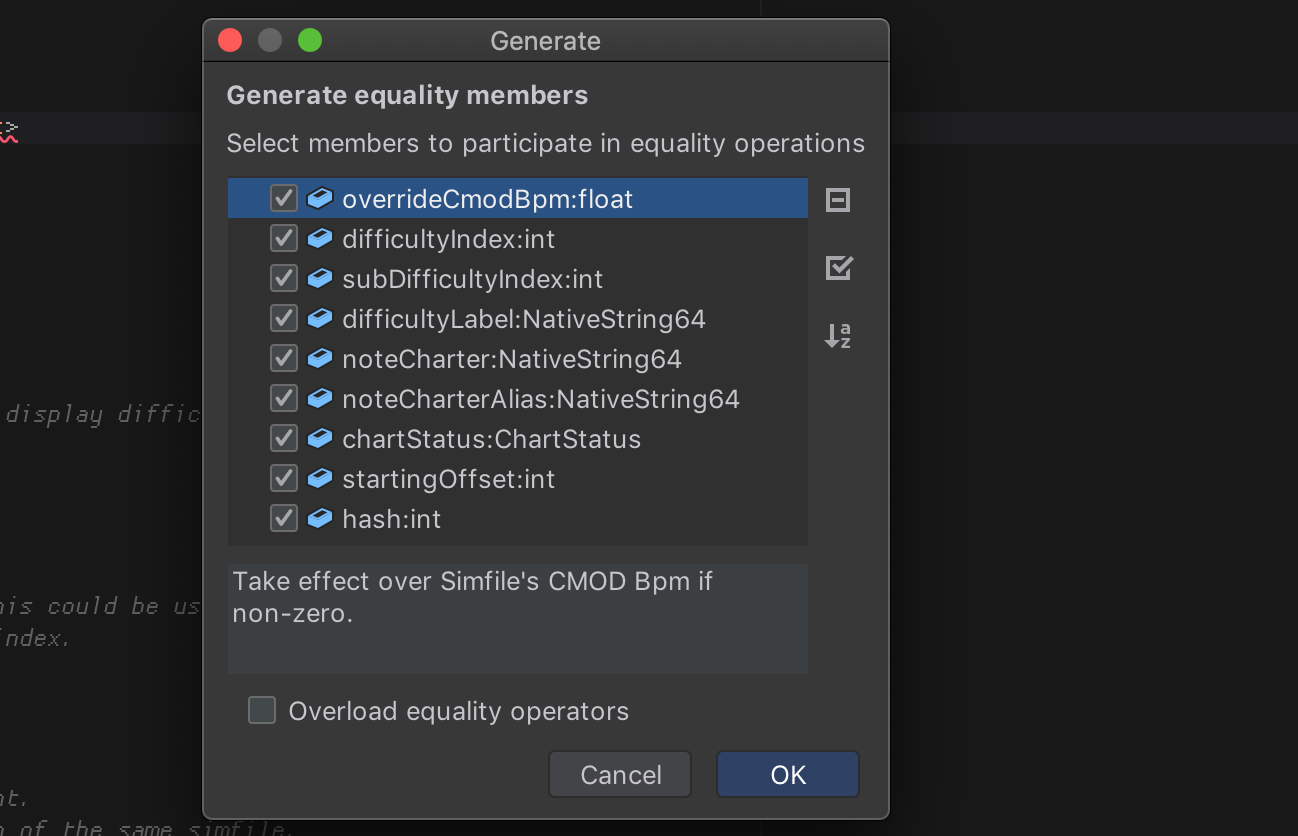
Generate equality members
Implementing IEquatable maybe more required than ever for Unity DOTS. This is a very welcome feature in ReSharper that is not available in Omnisharp. For example in some place like ISharedComponentData, ECS library may need your help to judge what is equal and what is not.
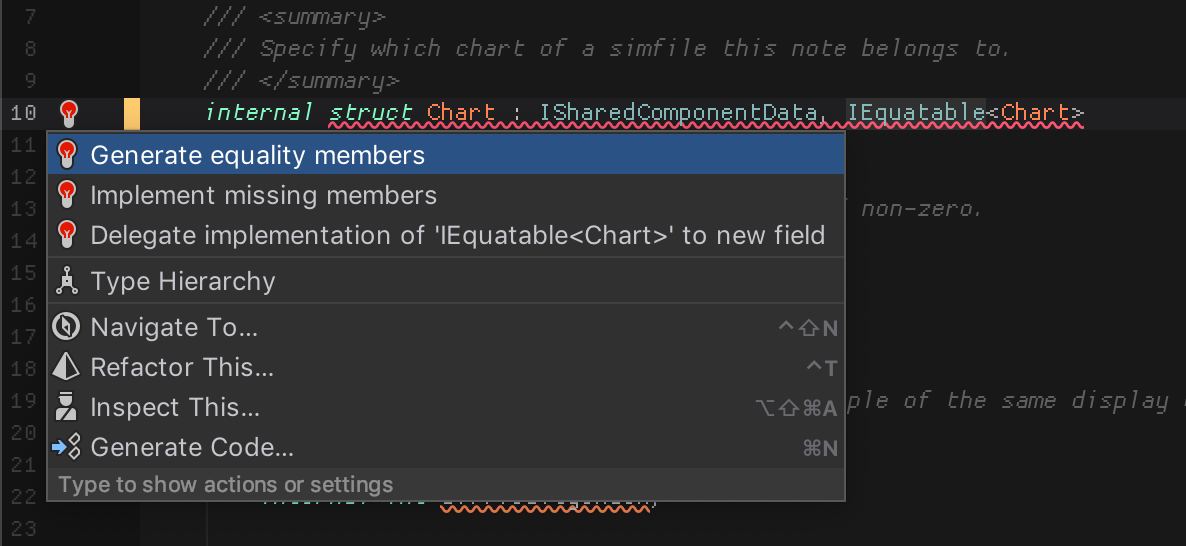
You are then present with a dialog box that you can manually choose which values matters in an equality test.
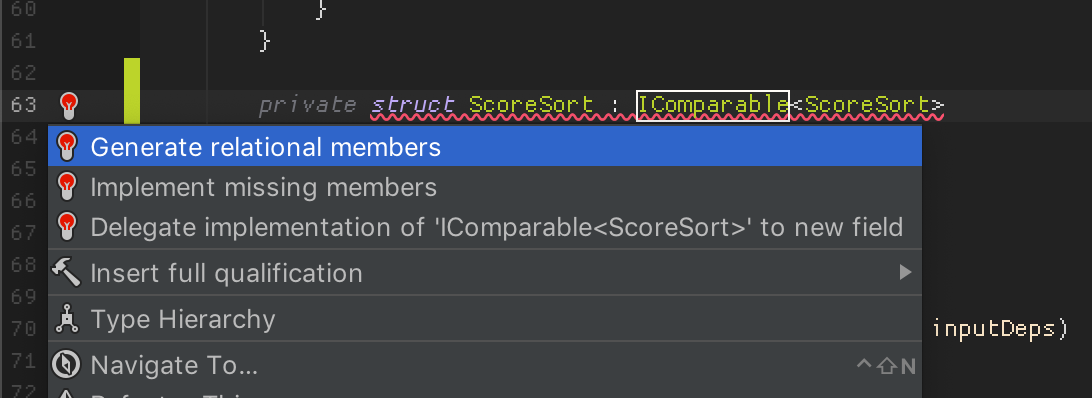
Generate relational members
IComparable is no less important than IEquatable. It is already used in multiple places in Unity ECS. For example sorting. NativeArray<T> or NativeArraySharedValues<T> could sort if T implements IComparable. In ECS we cannot ensure order of entities coming out from database. Some algorithm sometimes need sorting.
And when you implement IComparable, you remember that "compare this first then if it is equal, see that next and so on." tedious pattern. The command Generate relational members could do it for you in an order you want.
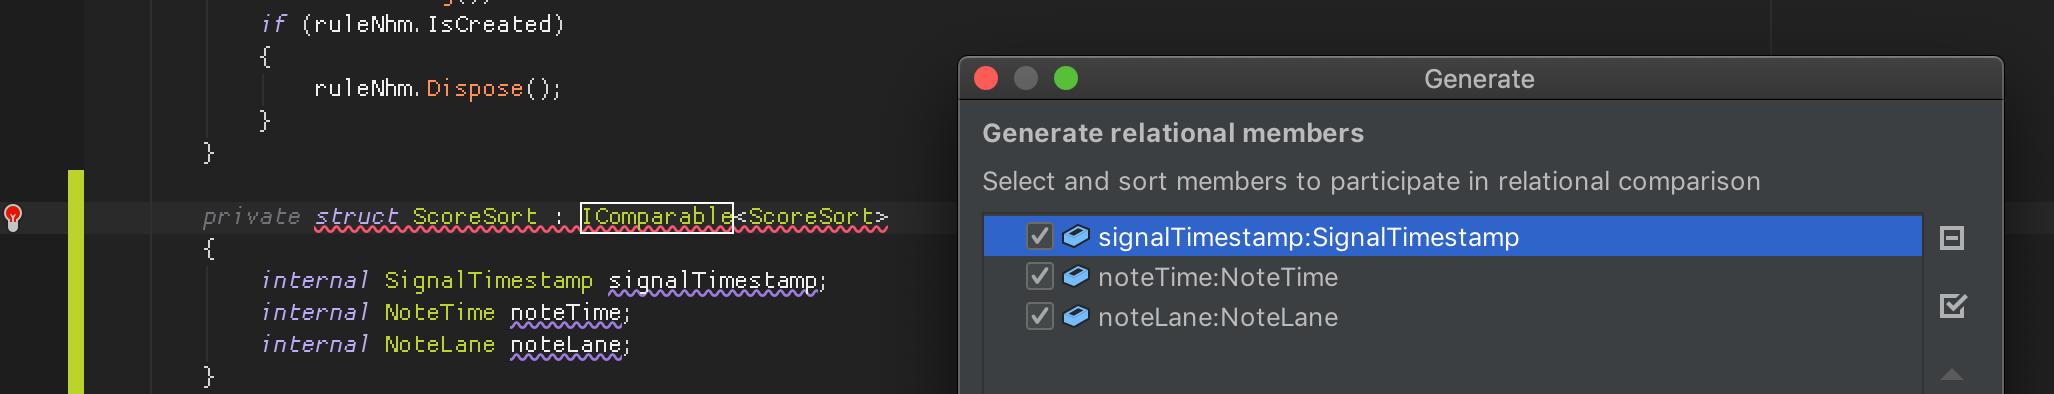
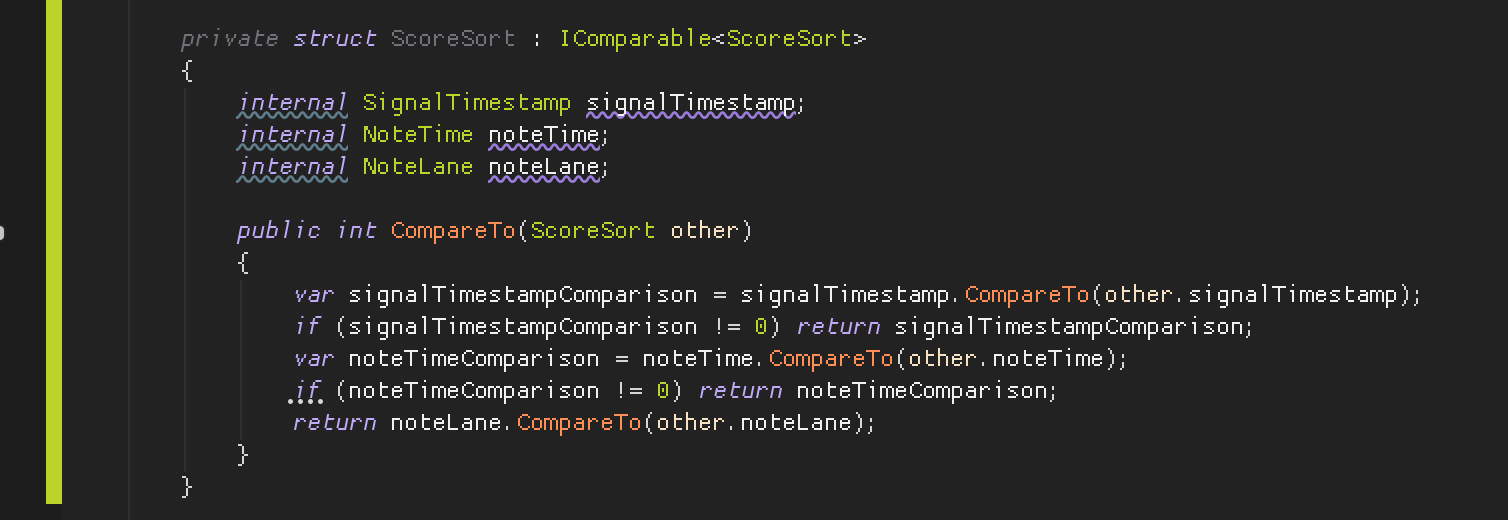
If you add more members and want to take them in account, you can delete the CompareTo method then use the same command again.
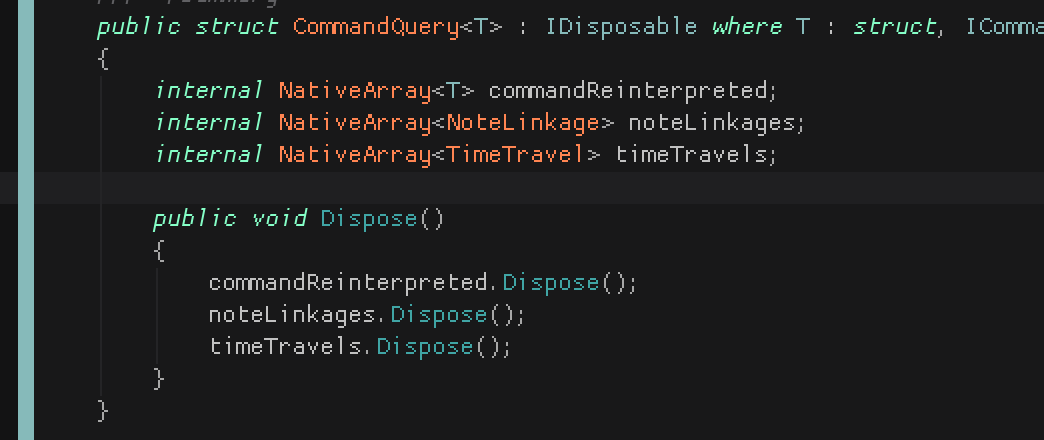
Generate dispose pattern
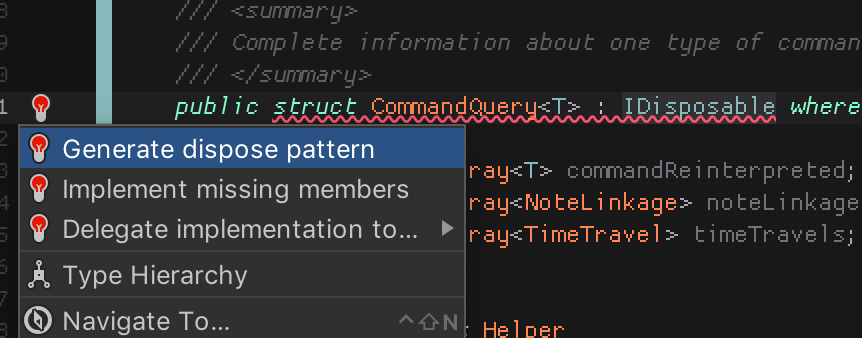
This is equally useful in Unity DOTS where you manage your own memory. It scans all your IDisposable and DOTS follows them.
Generate switch labels
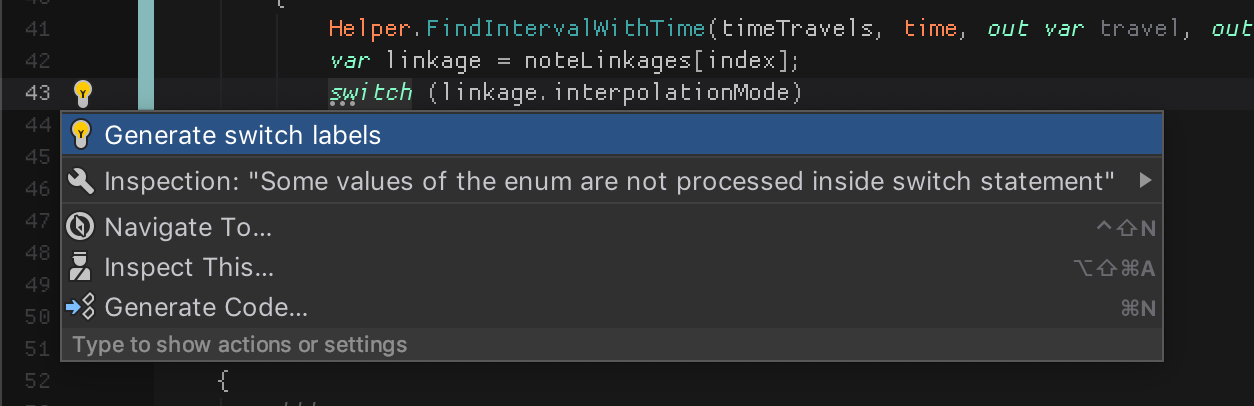
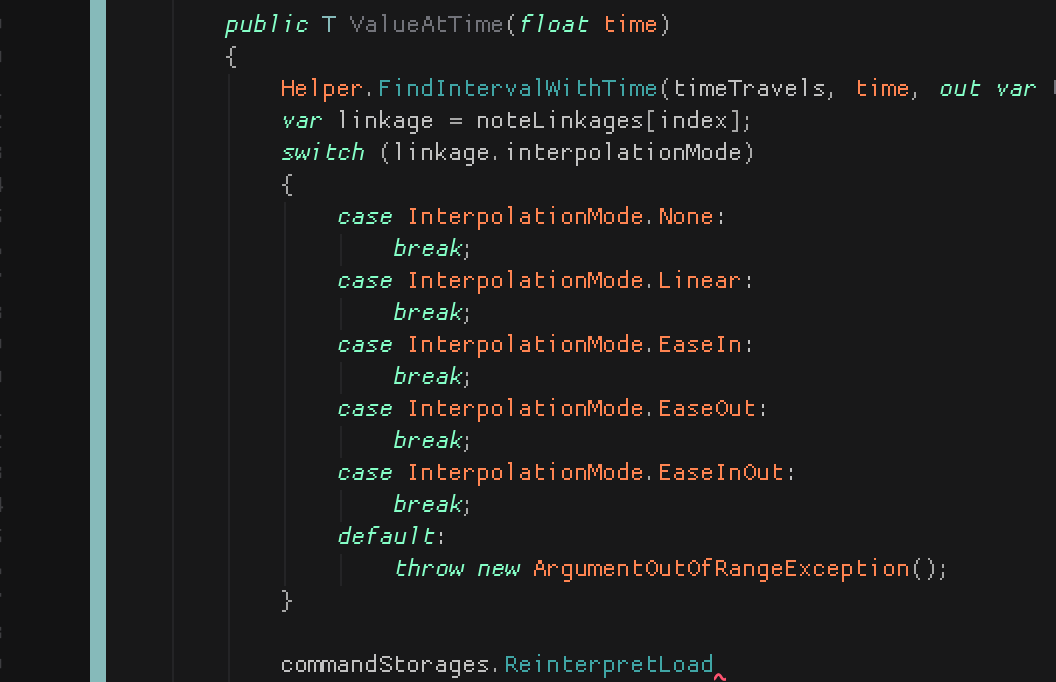
Nice. In DOTS, switch casing on enum is preferred for high performance jump table generated in assembly.
Overloaded operator coloring
In Rider you can see an operator with custom behaviour as differently colored by the color theme. Plus you can also use go to definition on the operator. This above example highlights that it is int4 SIMD operation from Mathematics library, not just C# built-in addition.
Local/internal UPM workflow
I have already highlighted how important you should UPM your own project even for those you not intended to open source.
In VSCode, your project is a folder. When you follow a code into your own UPM package, Omnisharp is able to do so because it ask .csproj about them. And you can also edit the file if that UPM is on local.
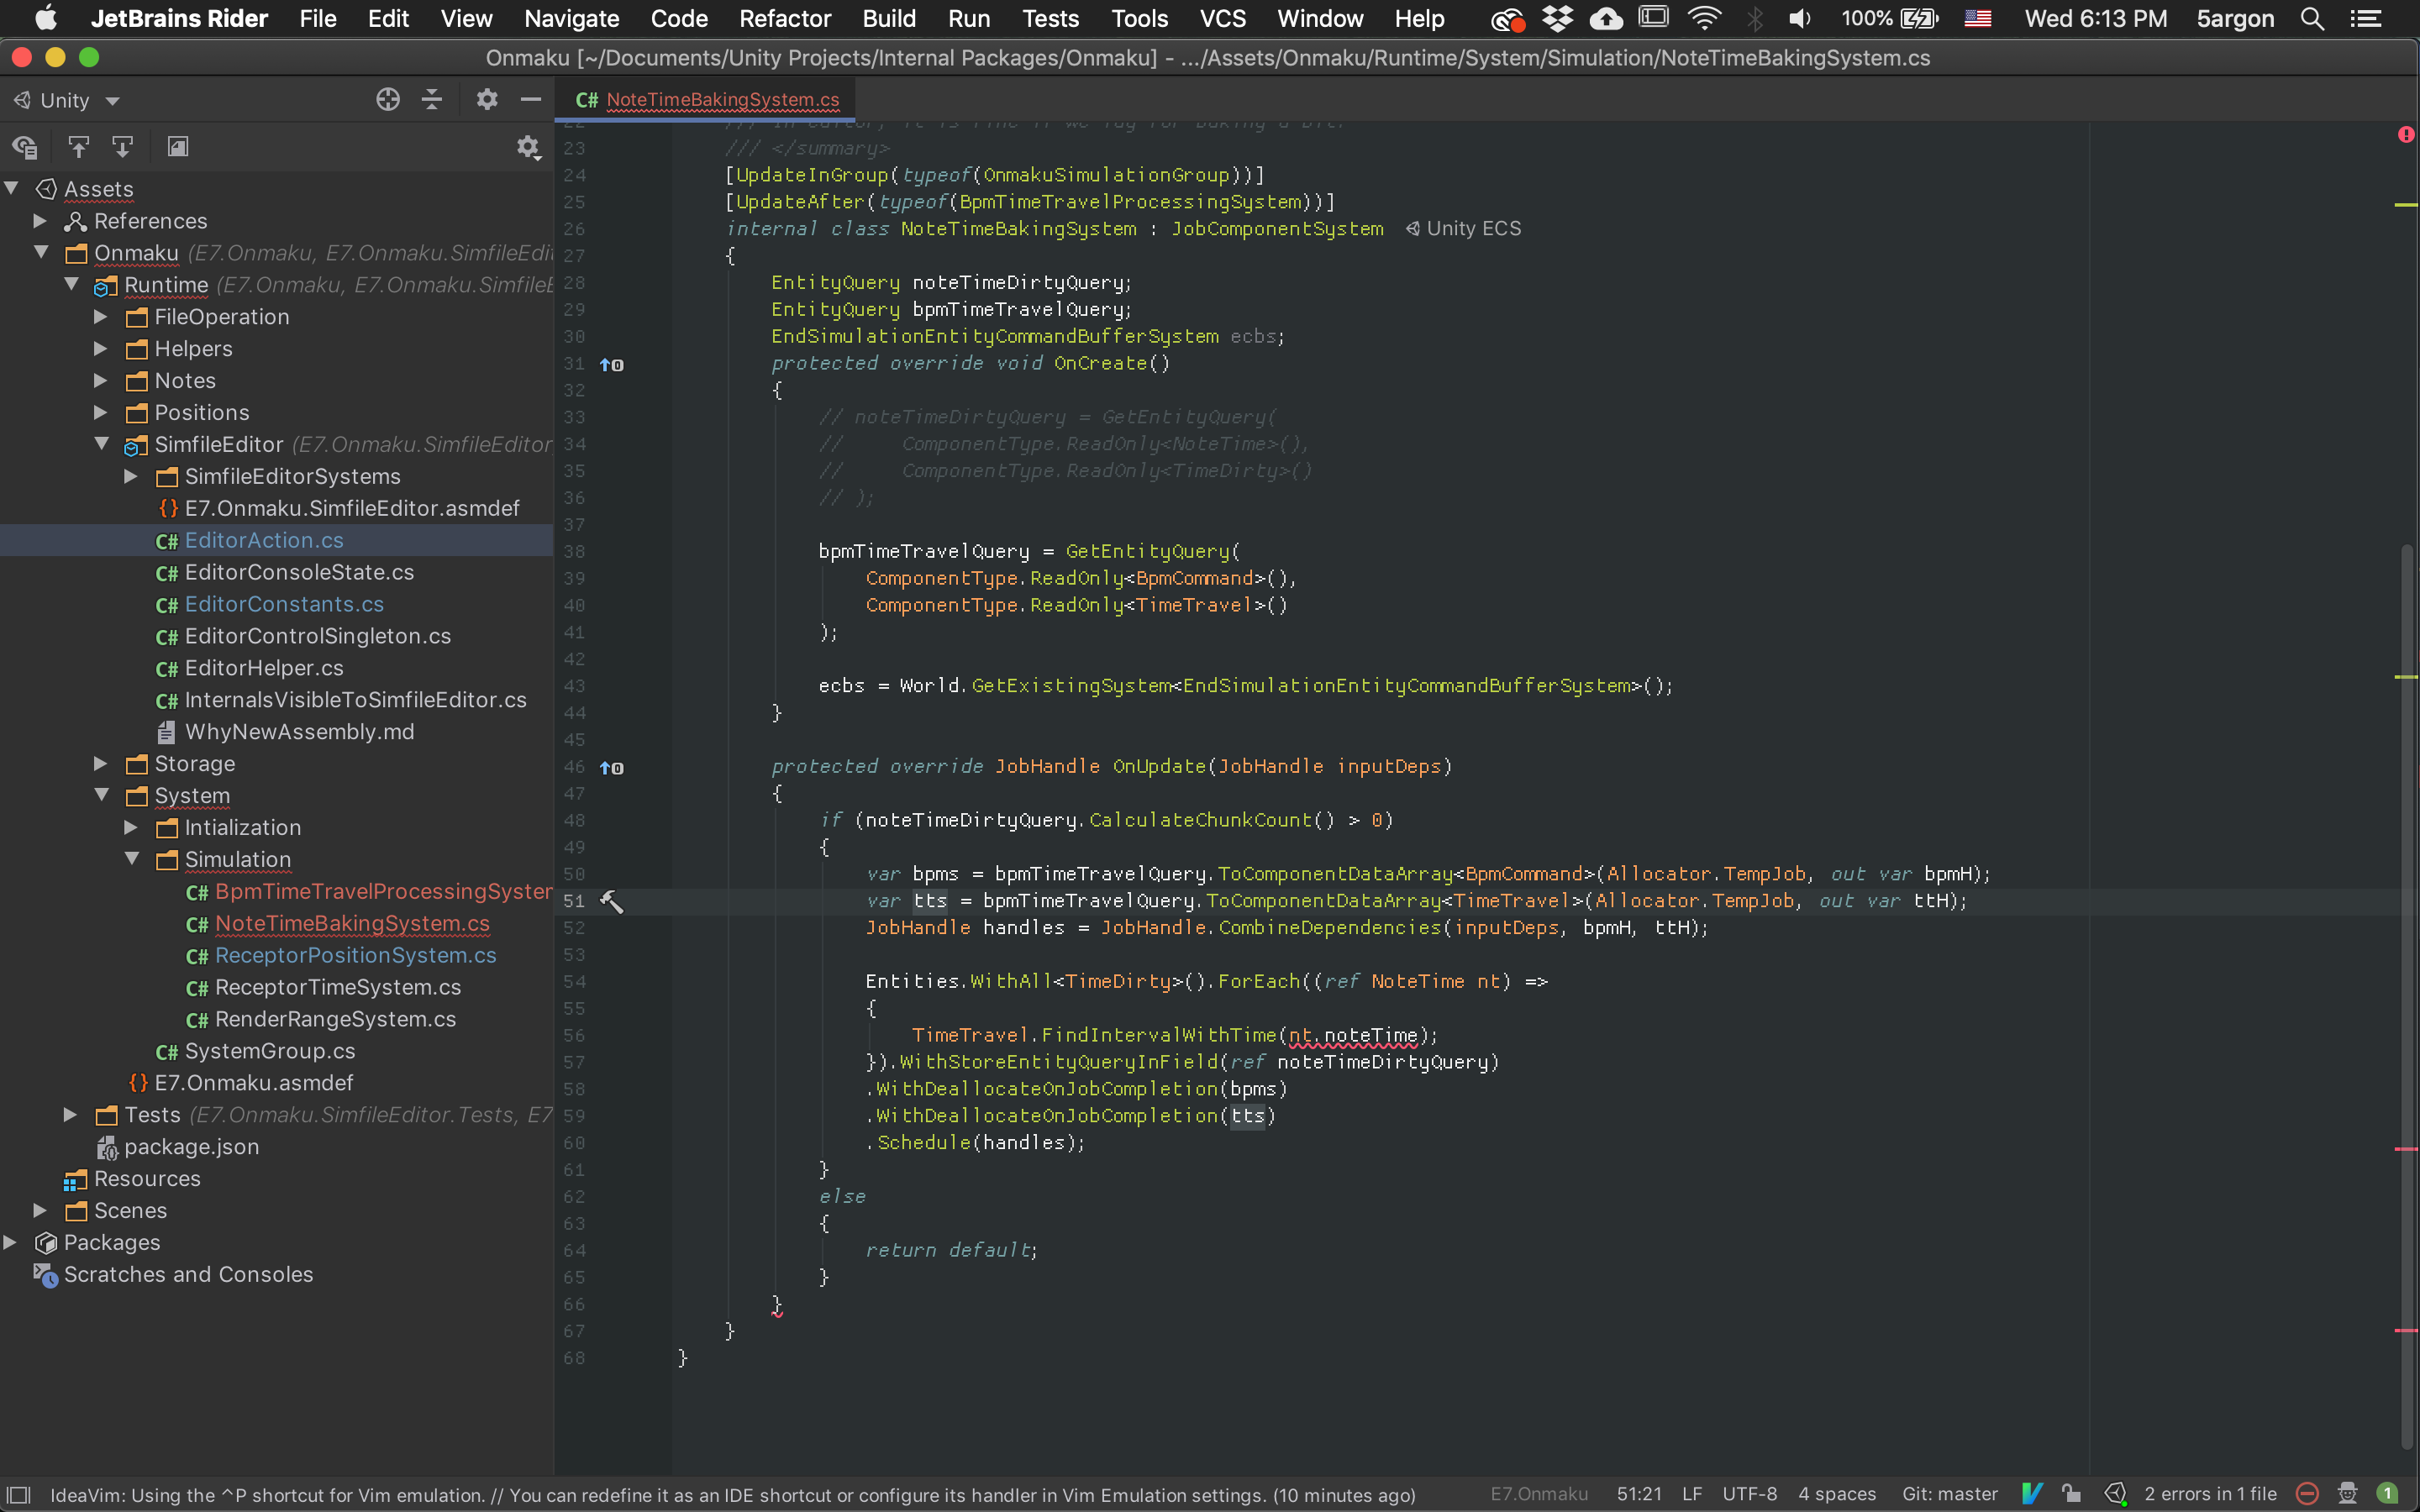
In Rider you can do the same, except you can see the project tree of that package. Because Rider knows Unity! A folder with arrow and a box is local UPM.
I think this is nice because in VSCode I was limited to use Go To Definition to go to package's file and modify, I was not allowed to freely browse any other nearby files in the package and must find a way to other files by Go To Definition. It will not be highlighted in the project panel either because you are now out of your project. Rider make it so all packages (non-read only) feels like a part of your project, just like in Unity's project panel.
Easy to UPM your game
By extension of this, you can drag any file to the UPM folder while editing code. You know how painful it is to move file around in Unity. Every little touch cause the spinner of doom. Editing asmdef even display a dialog preventing you from doing anything in the meantime. (Though even if you could, the editor lag so bad you cannot click and drag anymore file anyways.)
Auto refactor works. Renaming things in the UPM package from your main project works and updates your main project too. Overall this is the key feature to modular and testable game code. (You can have an another Rider instance that is opening that UPM as a main package too, though you can edit your package from your main game just as easily. This is not the casse with VSCode.)
Breakpoint vomiting values
I really like this polish in Rider. When a breakpoint is hit, you see each line vomit out all of its possible innards in code comment color without even hovering a mouse and check on the stack list. Therefore it could work well in a code that you "chop" to multiple lines.
This helps greatly to understand the surrounding even the one I didn't intend to check on, but ended up being where the problem was propagated. I had fun with this feature.
It really helps too that the returned value is at the first in list, and it turns orange if there is any change compared to previous break. I could glance and see everything without tediously register each variable for view or fumble with the list below. It's right there in the code.
Documentation auto complete
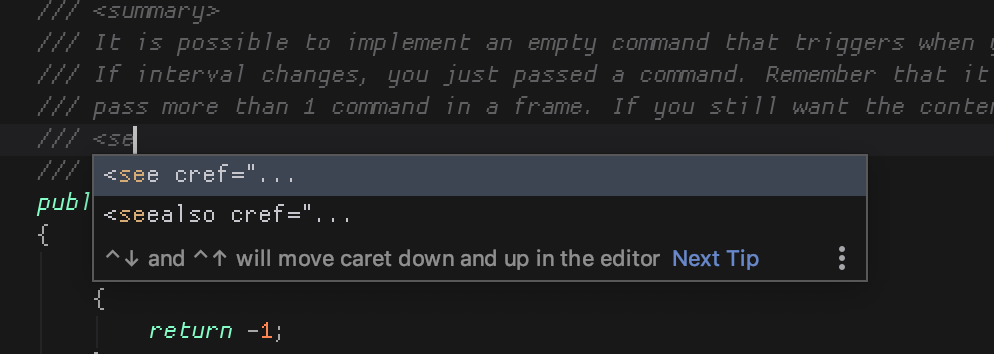
While it is also possible in VSCode via plugins to get /// to become summary, and also possible in VSCode to get autocomplete inside the "" part of see cref, and it is also possible in VSCode to rename all the way to documentation, it is not possible to auto complete the see cref itself while it is possible in Rider. Small margin of victory but still, nice.
*If Rider team is somehow reading this, I would lose my mind if I could highlight lines in summary and make it go to <remarks> section via the cleanup menu!
Cutting comment to a new line
I was surprised by this polish also. If you press enter while in the middle of any comment, the new line will be prepended // to be a comment also. Of course when I do this I don't intend to type an actual code in the next line, it is 100% better than not doing it. I didn't know I need it before. It doesn't affect pressing enter at the end of line, or using o key in Vim emulation.
And if the next line has some spaces after // it would be formatted the same way. Great!
Almost ideal Import Missing Reference
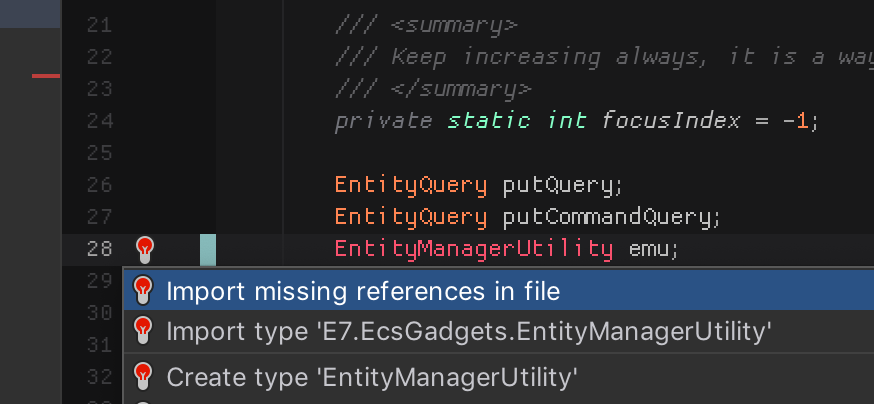
This function is very important in VSCode, as I code more properly with namespace, with asmdef and finally with UPM, it adds some hassle of importing things into scope. Luckily I can always do this to resolve them.
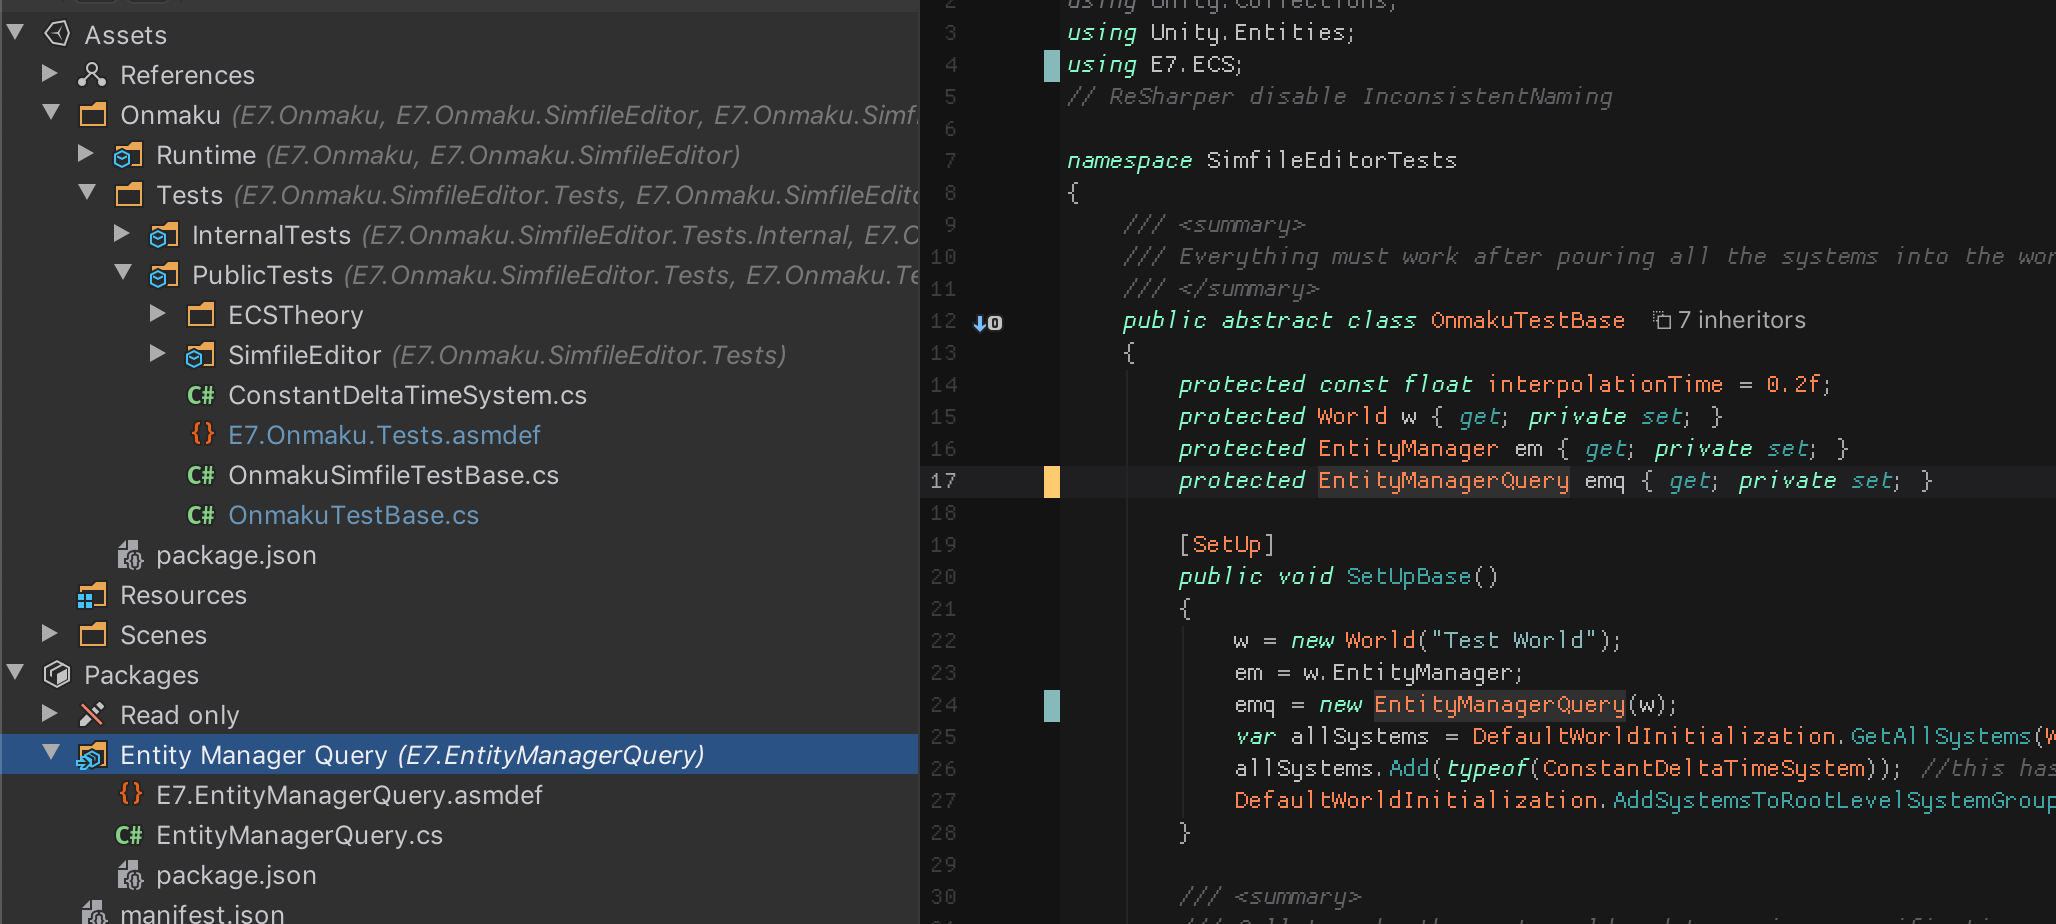
In VSCode if you didn't have a reference in your asmdef then Omnisharp cannot resolve it for you. For example, DefaultWorldInitialization is currently red. VSCode cannot know that this particular class is in Entities.Hybrid assembly because you didn't link the asmdef yet. You go link it because you know, then it could help.
In Rider it is a bit smarter. It seems to know Unity to the level that it knows the class from packages linked to your project manifest but not yet to this particular asmdef. But even though the completion works and using was added to the head, it is still unusable because it cannot go to your asmdef file and add missing cross- asmdef reference for you. Almost perfect!
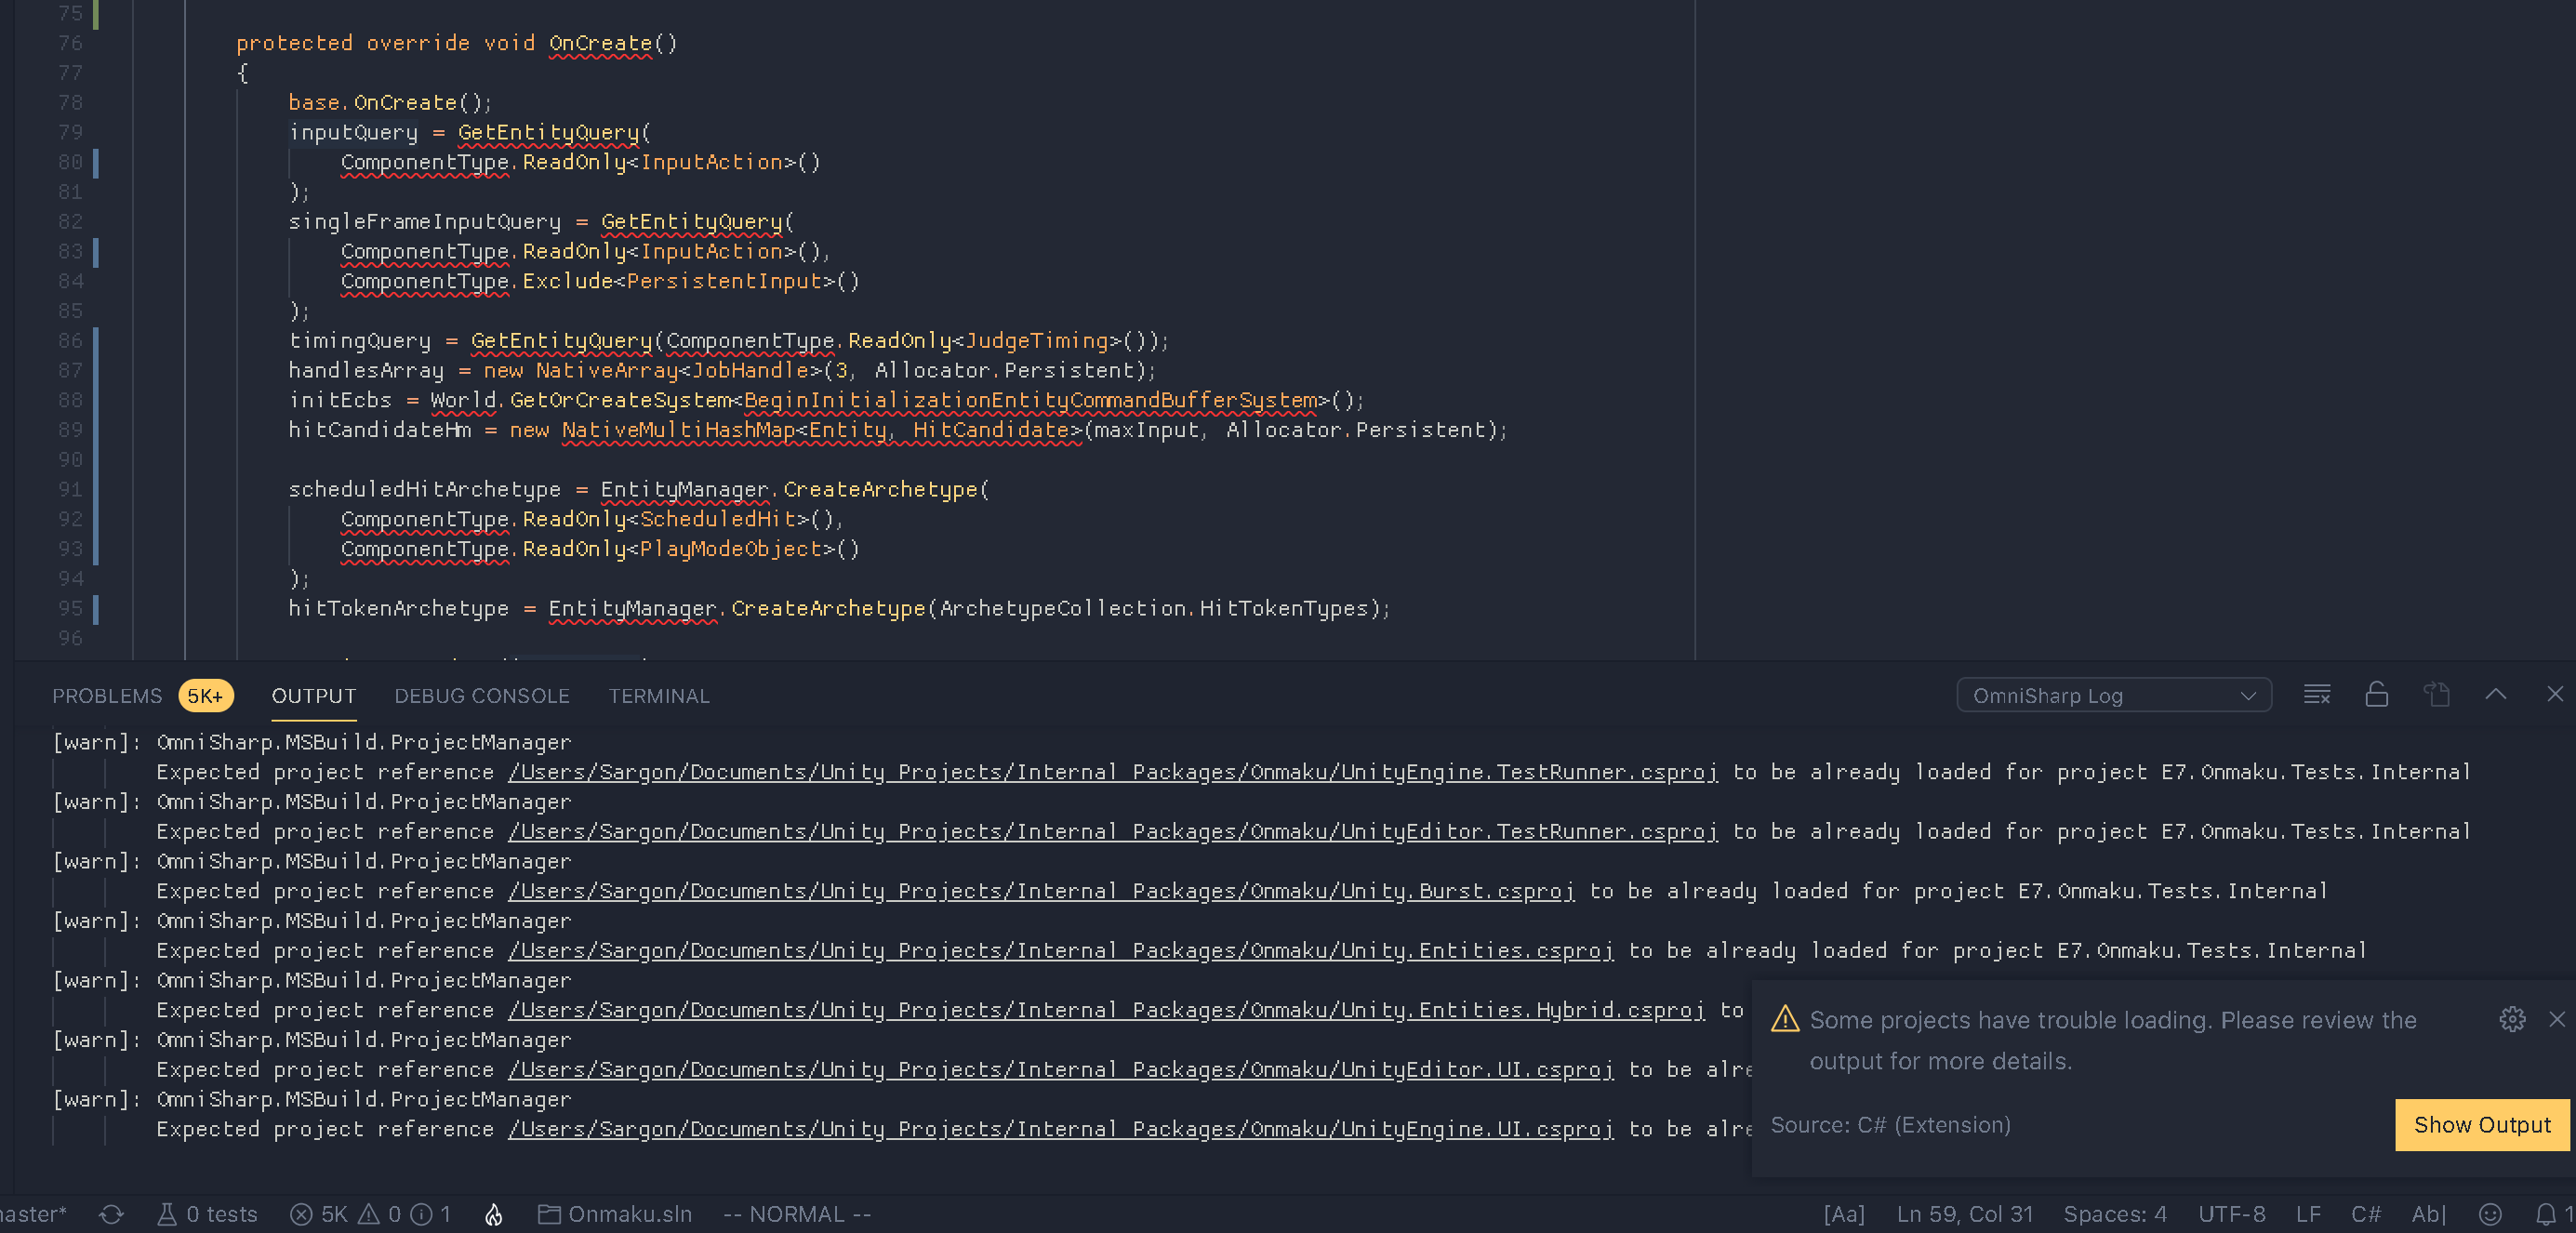
ReSharper is more stable than Omnisharp
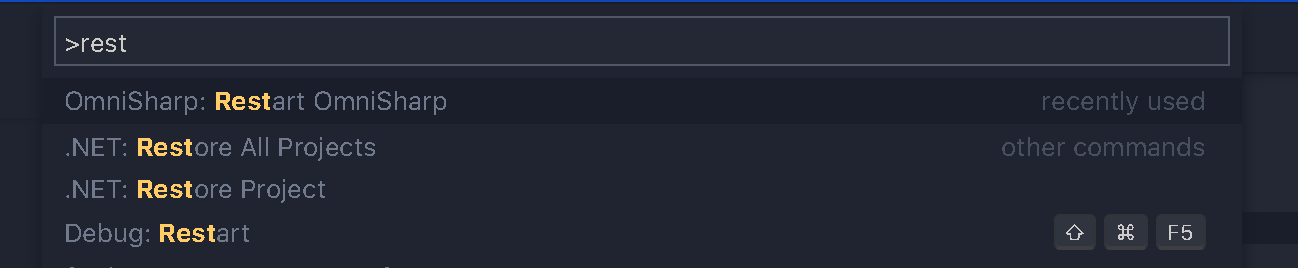
You know in VSCode when you do something too "outrageous", it feel like Omnisharp crashed and stopped being smart. When you check the Omnisharp log in the popup console, you will see some errors there but Omnisharp will not recover on its own.
This is solvable with "Restart Omnisharp" command which you will have to wait about an equal startup time of typical IDE like Rider. It is just VSCode that startup fast, not Omnisharp. (depending on project)
I sometimes see Rider goes all red too, but after a few moments it seems to be able to get a hold of itself fast. Granted this cause some performance hit but still better than having to restart the language engine often.
I suspect this "goes crazy" moment is when Unity decided to flip the table and recompile too many links (in not an incremental way, etc.) and Rider/ReSharper handles this more gracefully.
One backspace to bring up to the previous line
When I would like to format the code so it go back to the end of previous line, I think there is no good Vim commands to do this fast enough other than cut and paste at the end of previous line. In Rider, pressing only 1 backspace at the beginning of the line for these 2 cases will bring it up, given that there are only empty spaces to be deleted.
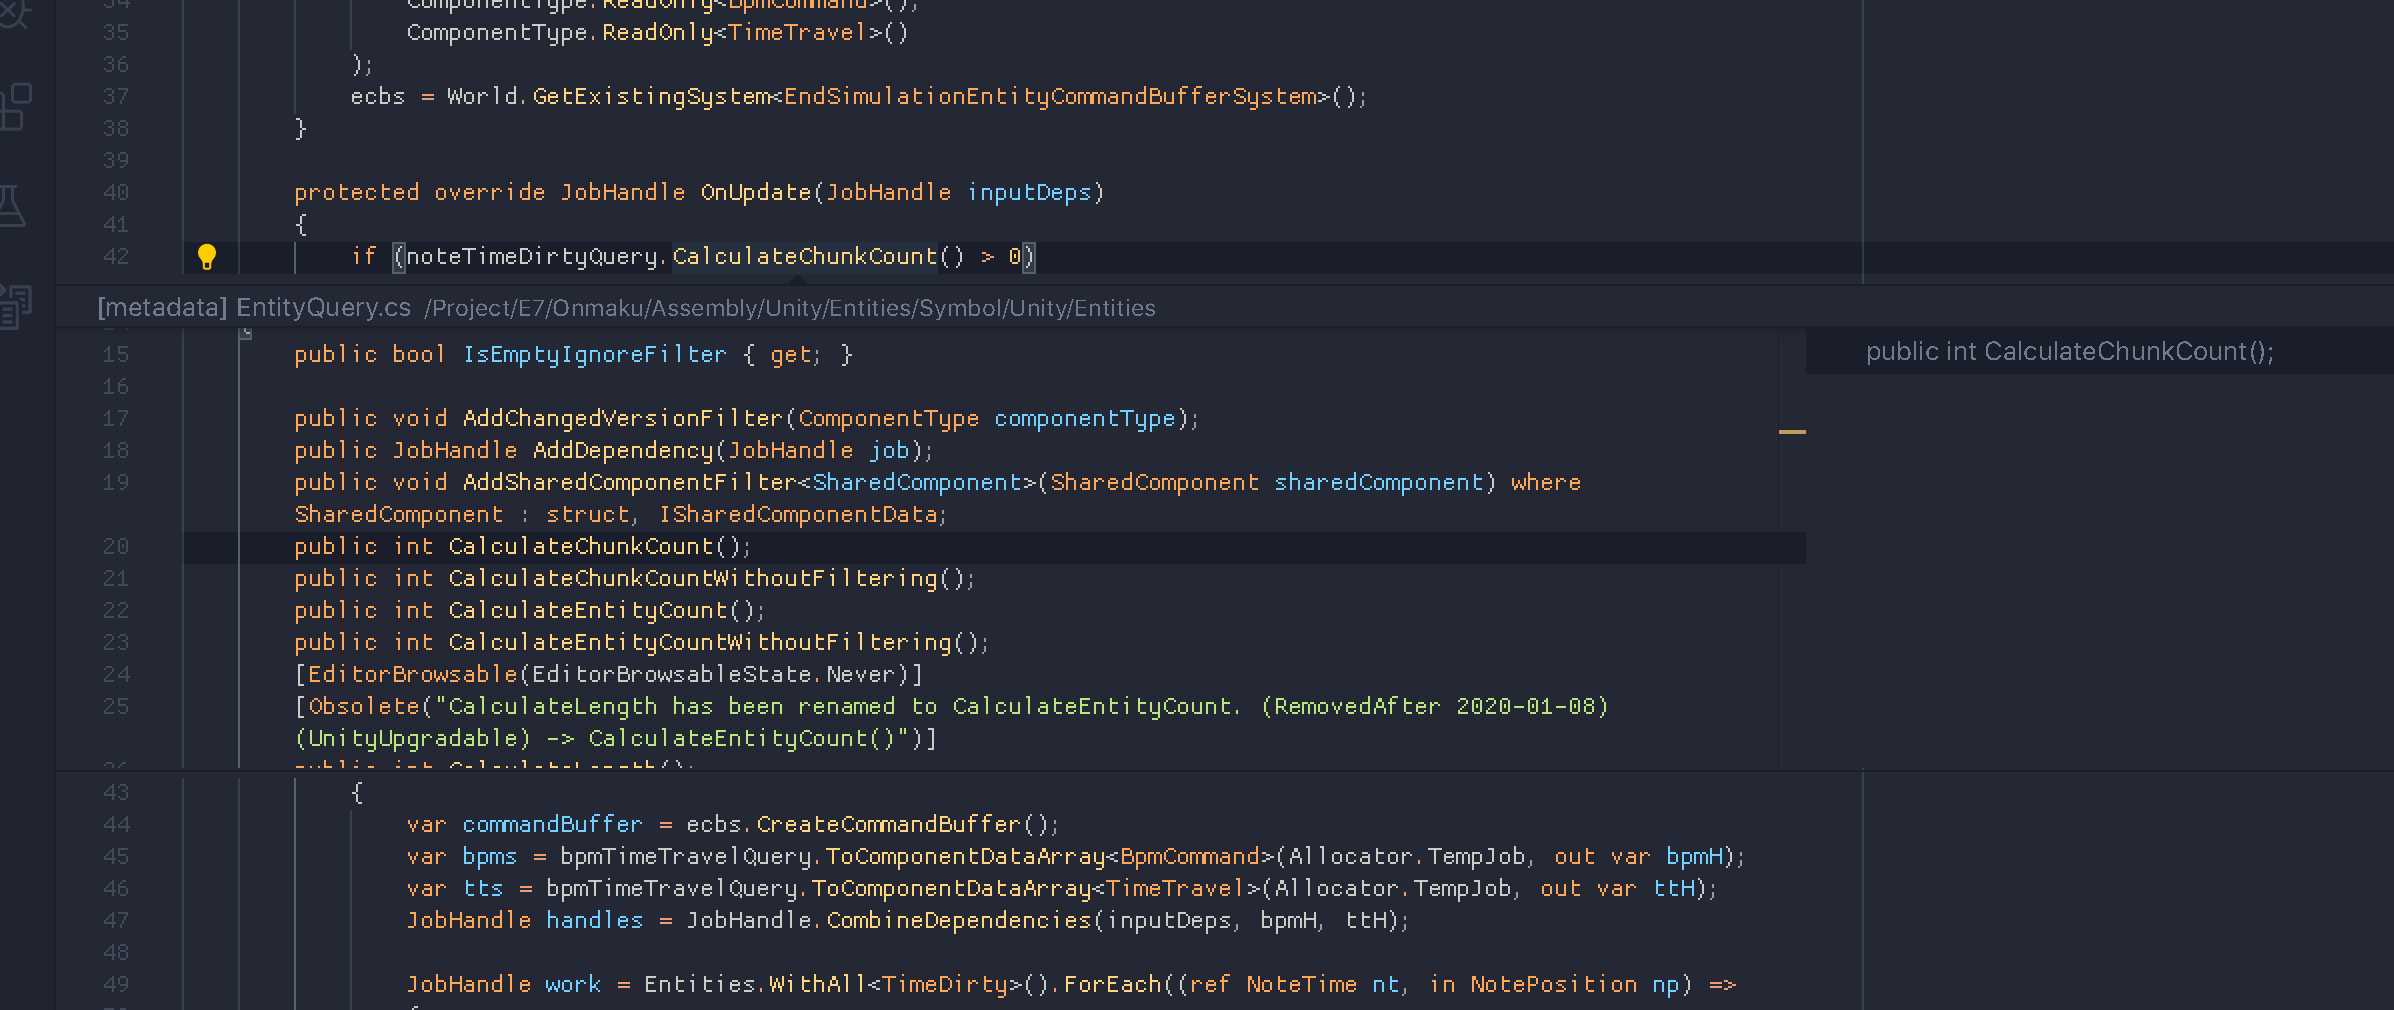
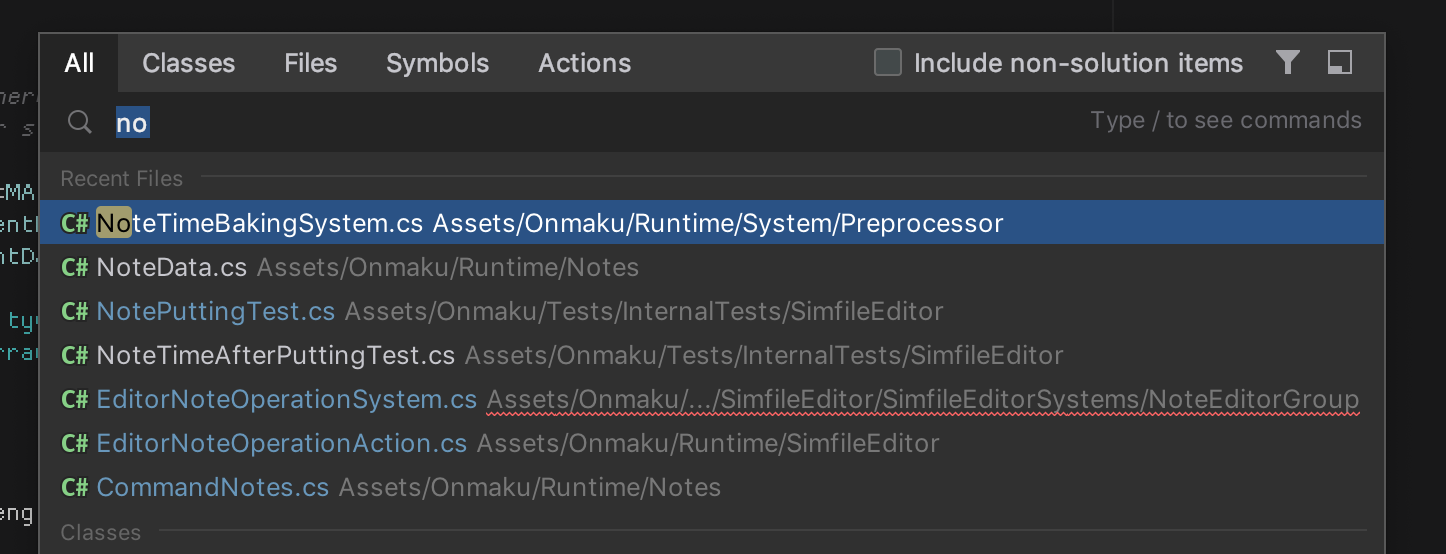
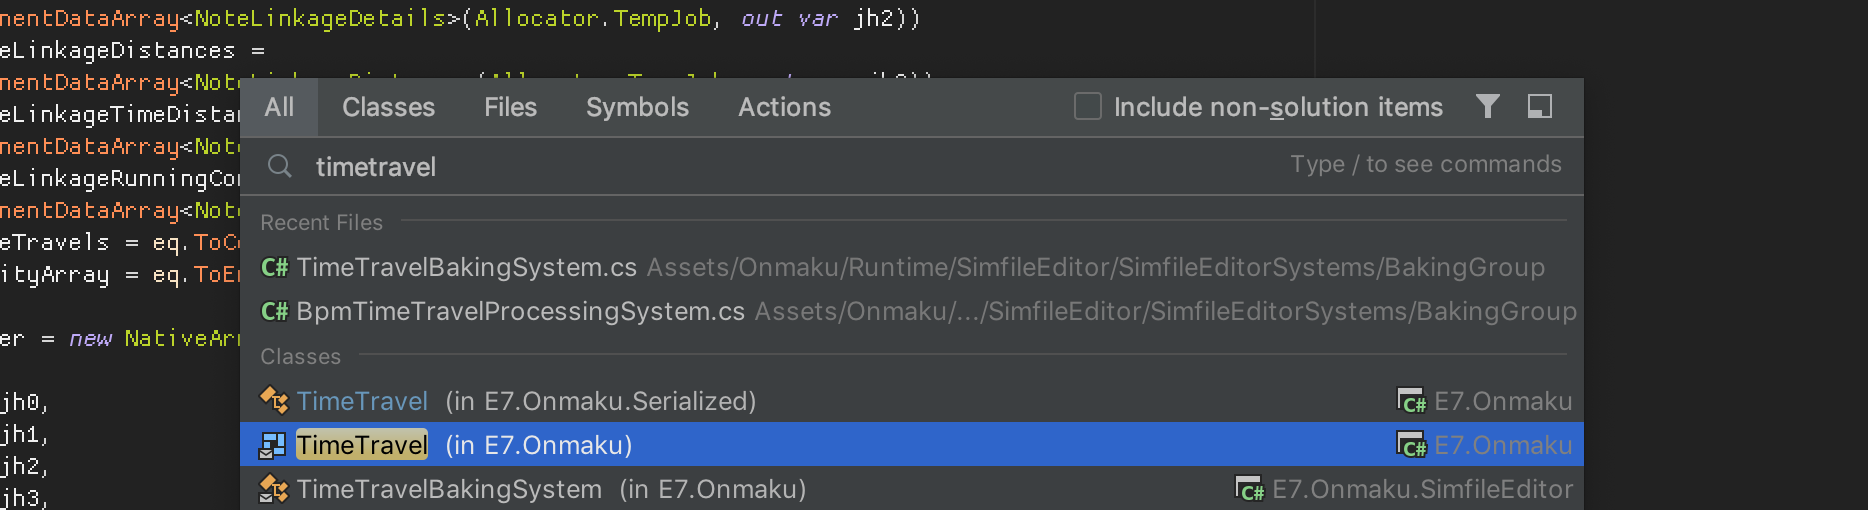
Search Anything includes class/struct
It maybe a practice to separate class and structs to its own file. But in Unity Entities you probably have a LOT (100-200) of tag components used liberally, or a component with very little content (it is common for a component to have just 1-2 fields) which you ended up grouped together in a file, or even in the system file (which may make sense if you want it to be used by . notation after system name, like ISystemStateComponentData).
You then remember the struct name because you work with them always, but forgot what is the class name. Many times I have to find an instance somewhere just so I could use Go To Definition to go to it without knowing file's name.
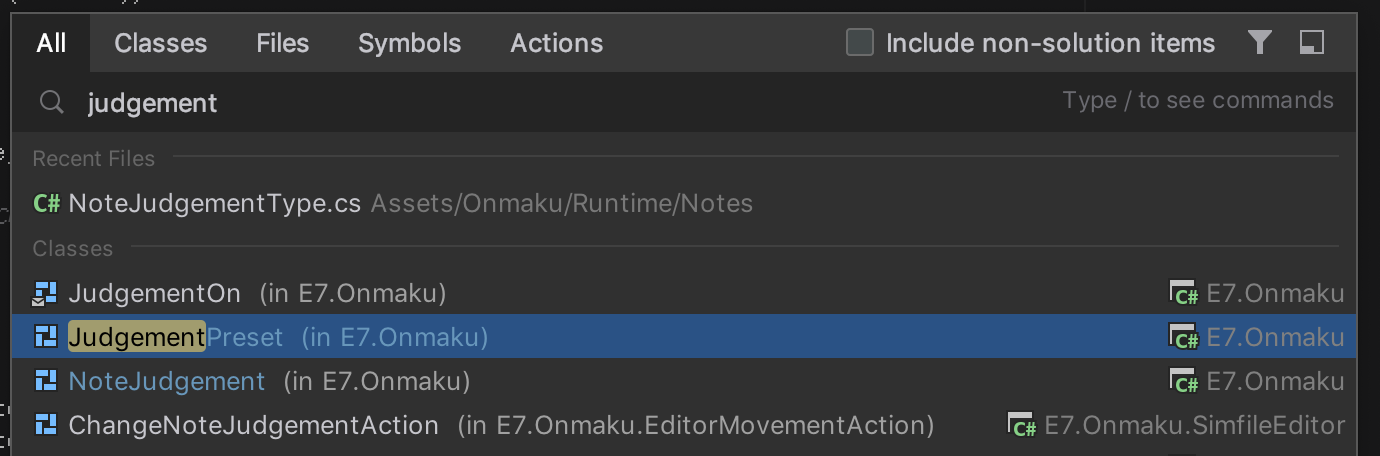
In VSCode, class search only applies to the currently working file. In Rider you can type the class/struct name you want and it will go to the correct file. Unexpectedly convenient. I really miss this when going back to VSCode, it is difficult to remember which file I tucked that in. Sometimes the file was named exclusively, sometimes the file was named as one of the struct in there that I think is the "boss" of all other structs.
Also, if the class or struct is named the same but in different namespace, it could be easily discernable with the (in ...) followed the entry.
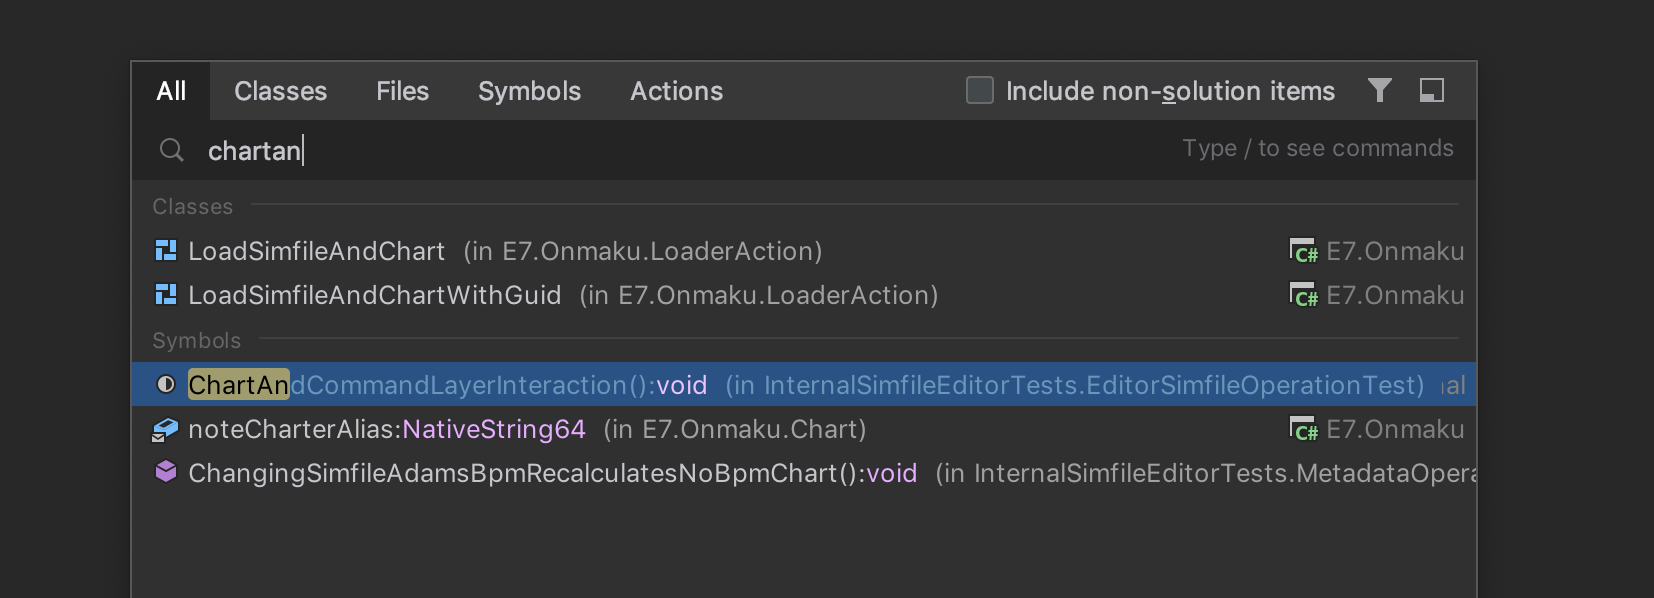
Search Anything includes methods
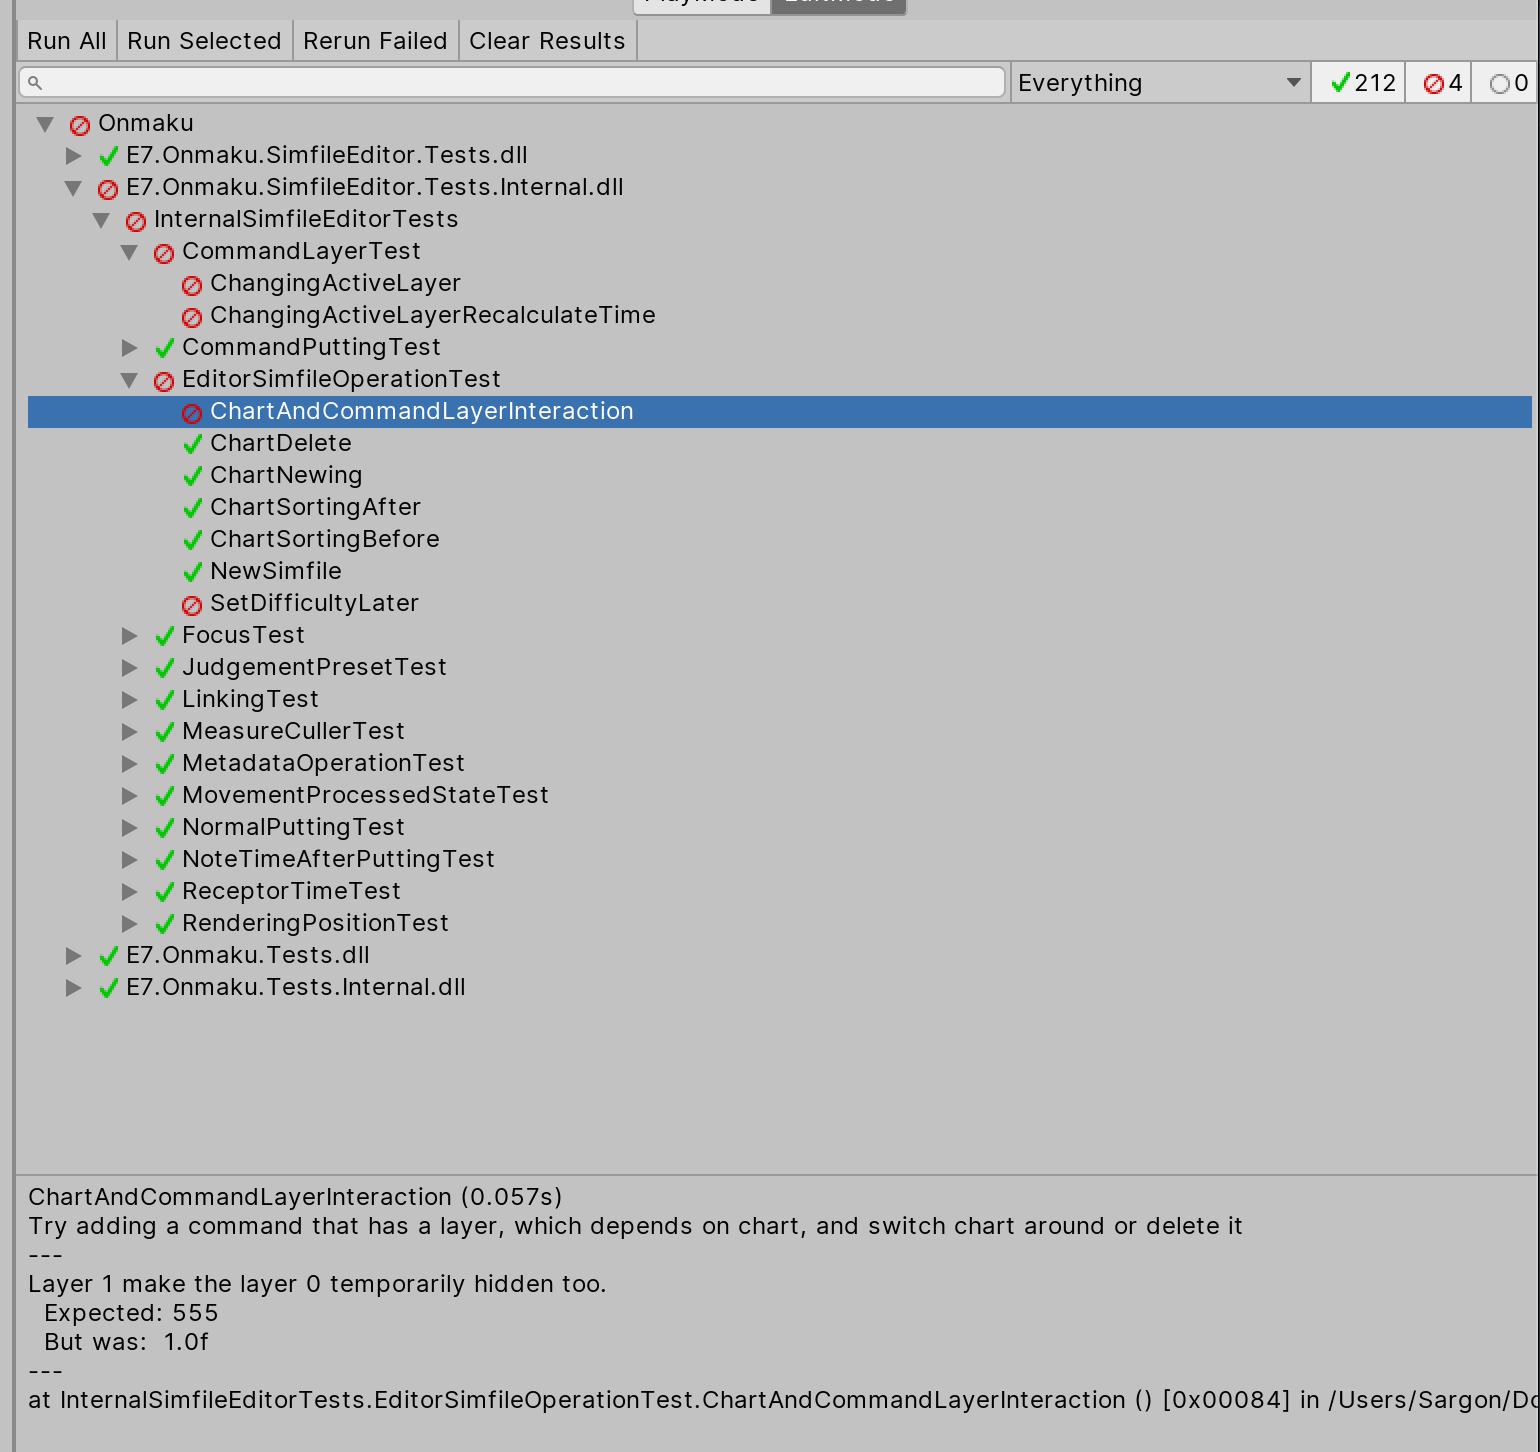
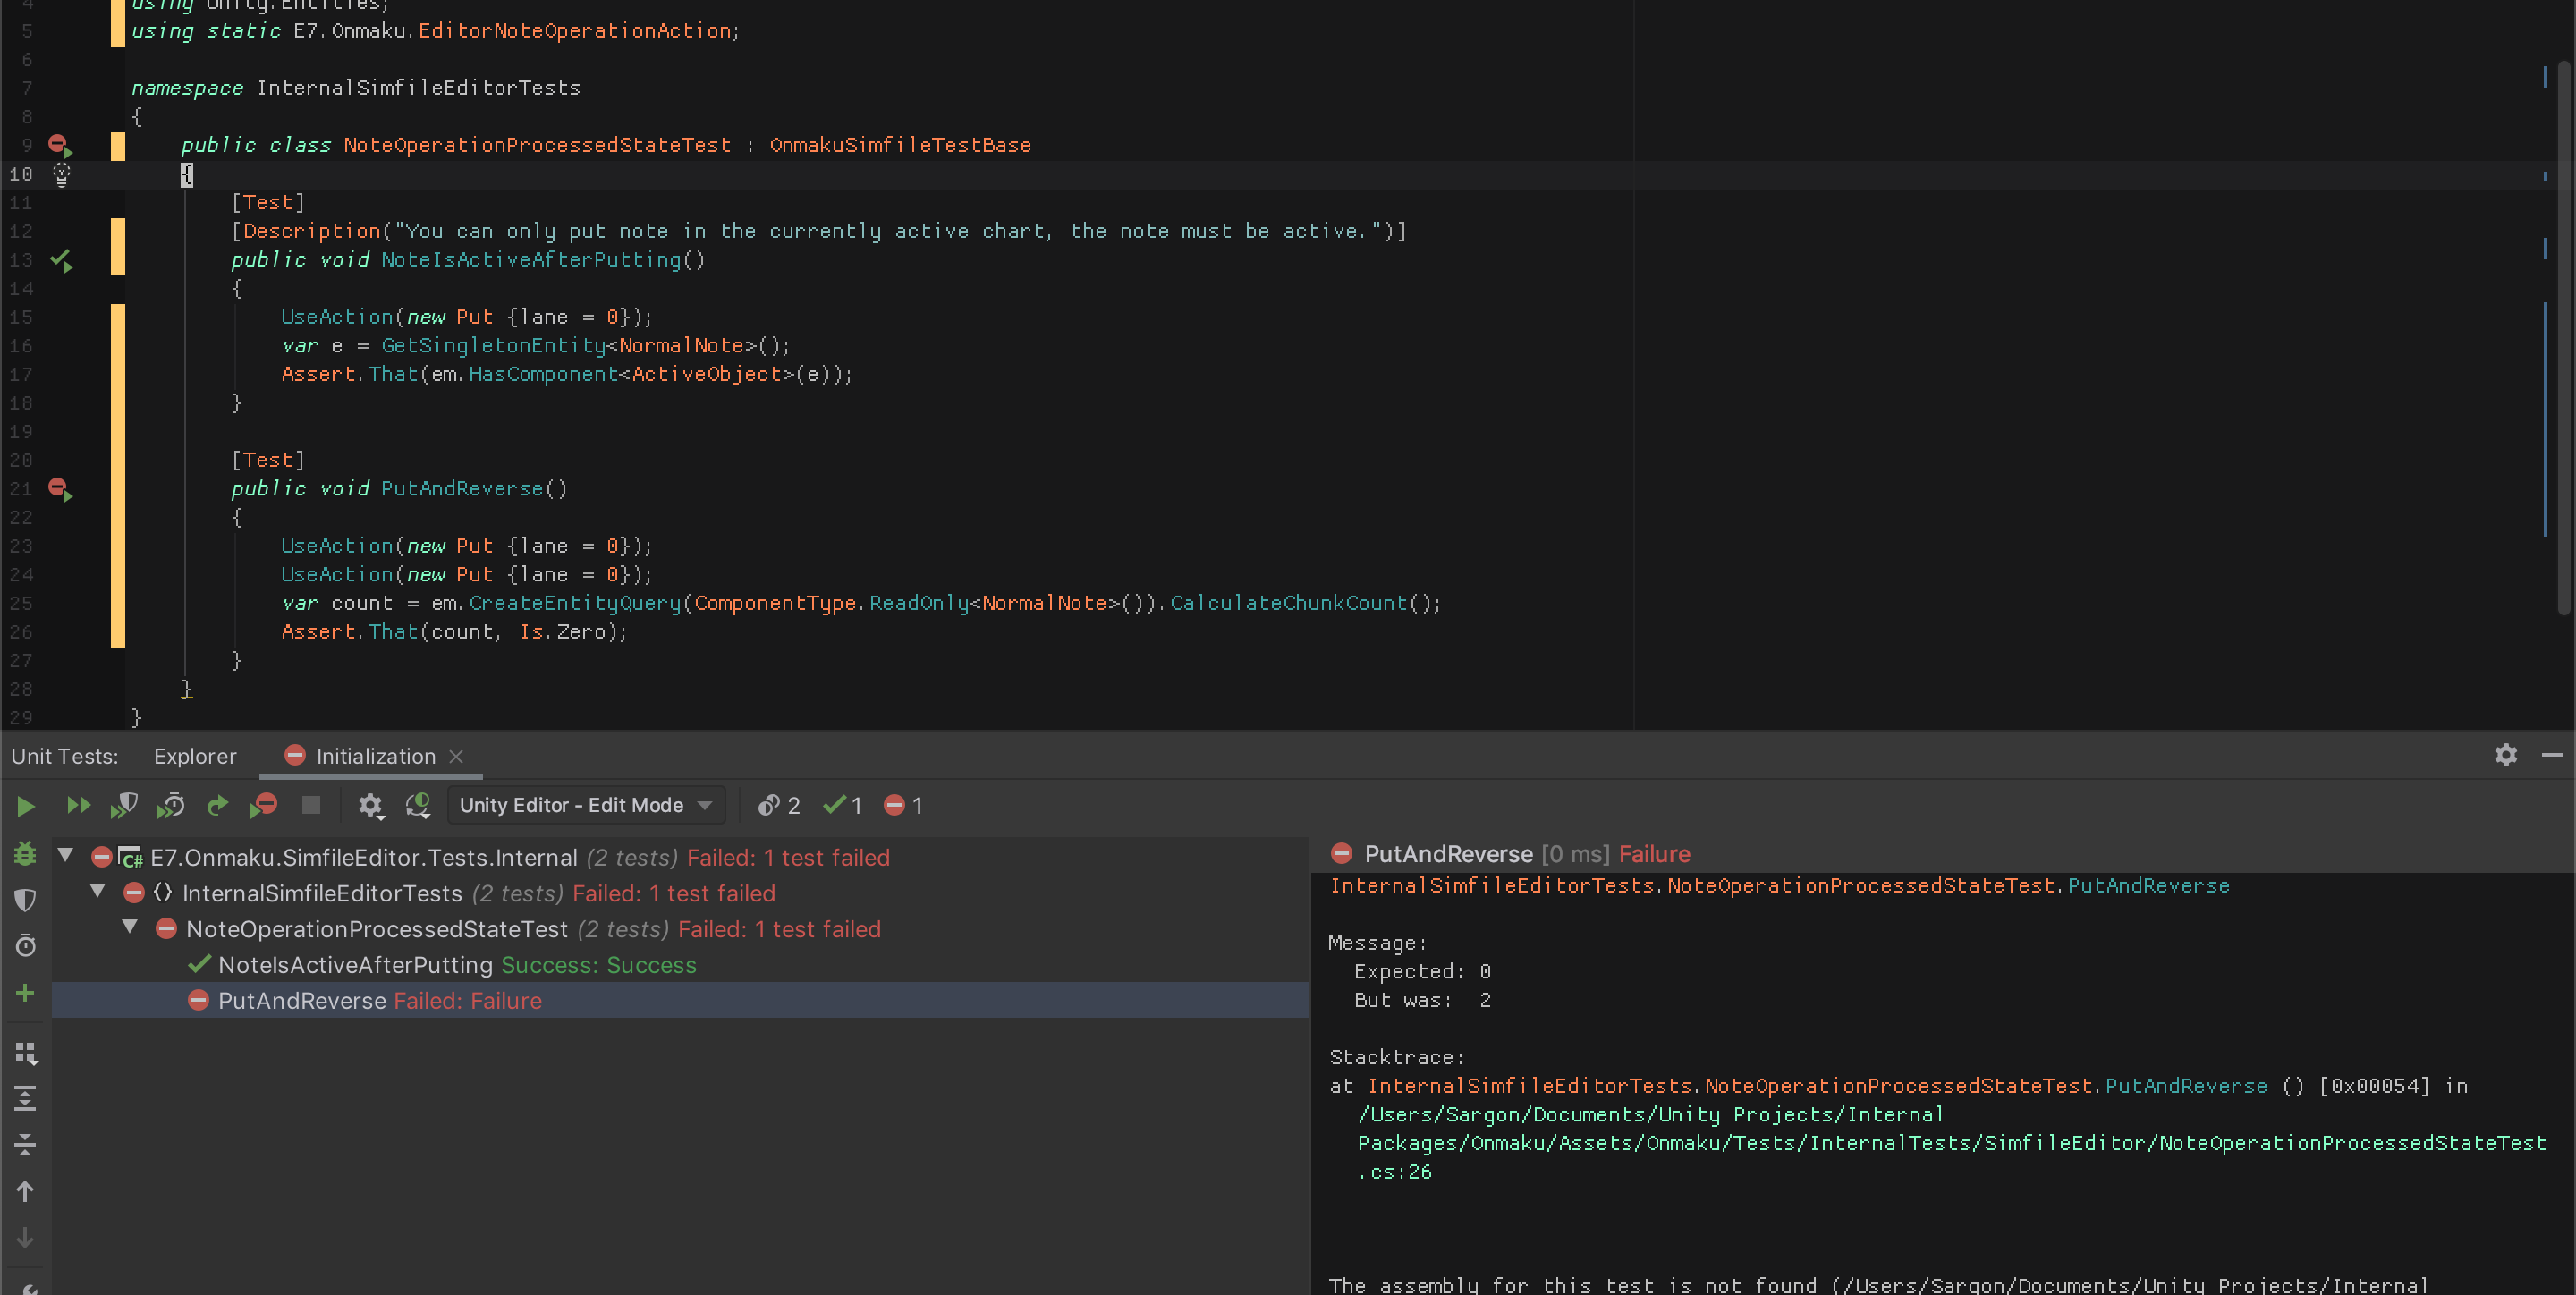
It means any method in any file.. so it really is "search anything". Why this matters? Because Unity's Test Runner has this annoying workflow where you have nowhere to click to go see your failing tests.
Because the test name is method's name, you can type it in search box and go to it regardless of its file. Note that there is no mention of file name in the Test Runner dialog. It is just namespace, class name, and finally method's name. Being able to go directly to the method is nice. But it would be nicer if the Test Runner failing message turns blue and let me click it..
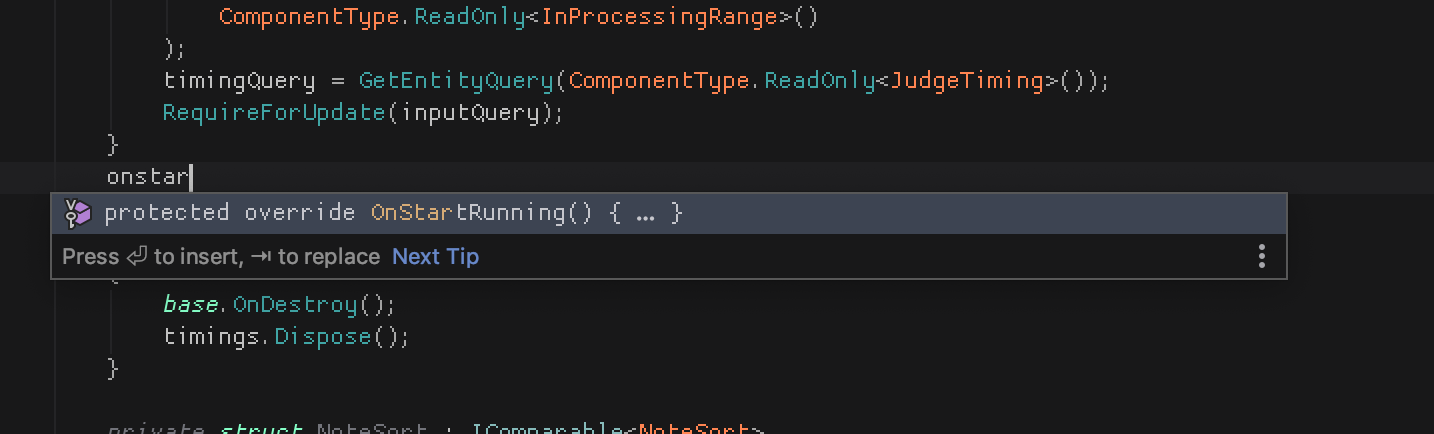
Autocomplete virtual/abstract methods
This is one thing I thought VSCode Omnisharp could, but it couldn't! In C#, one of the pain point is to type matching_accessor override ExactMethodName(SameType anyNameButYouRatherWantTheSame) correctly. Editor function should help with this chore. Unity was crazy about magic methods like Update() for quite sometime, but now the direction is going to the righteous override path in JobComponentSystem of ECS, that make it more verbose to type.
Actually I remembered Omnisharp could with some difficult condition that it is not so useful. The criteria seems to be you having to type all the way to protected override then some characters, or something? Then the popup finally appears. Also see this issue :
https://github.com/OmniSharp/omnisharp-vscode/issues/1044
In ReSharper, it works as expected. I can immediately type the method name and they appears. On accepting the suggestion, base.ThatMethod() is automatically added, an another pain point that C# didn't force overrides to also call the base, but often you want it to that you ended up making a common routine on the base disappear. (Luckily in ECS there is nothing at the base.. yet.)
There are quite a lot of override to do in ECS to properly optimize the system. (Query ceremony, pre-allocated persistent native array for reuse, etc.) This is very useful.
Junk entries in VSCode
In Go To function of VSCode, often I would see an entry that no longer works. Refreshing these search histories is possible, but in Rider unusable entries are never there. (But of course the performance is also less snappy.)
In Rider one thing I like is that when performing project wide search, when I check on each one and fix it, the "baked" search result will update accordingly to INVALID. This is a good middle ground between re-search and take performance hit or just left them be. In VSCode, the entry didn't change at all, and clicking on them will now go to random line that the search result was there.
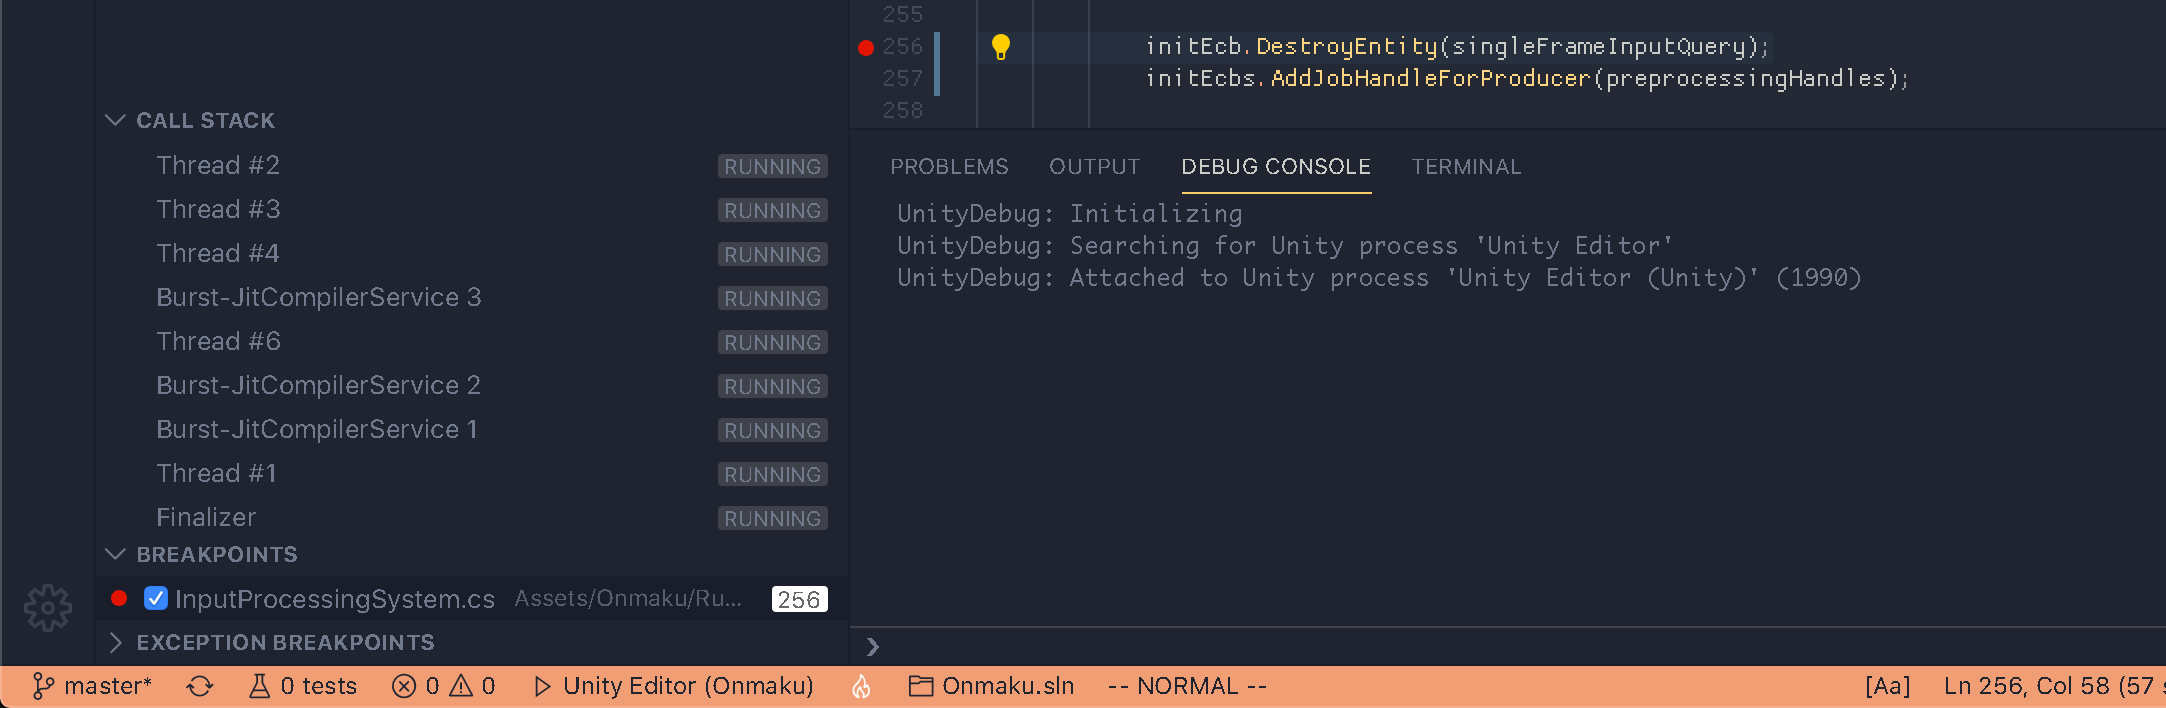
Editor attaching / breakpoint
In VSCode, I feel like sometimes I could get the breakpoint to activate but most of the time I cannot. I don't know an exact criteria, sometimes I have to restart Unity editor or VSCode and attach in a specific sequence.
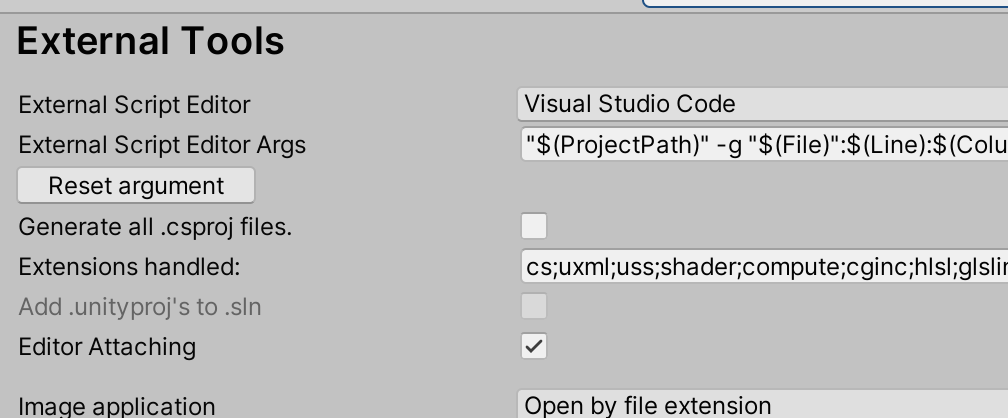
Of course I have this on when I would like to use breakpoint.
In ECS, it is quite important for unit test to use breakpoint where we couldn't use Entity Debugger. Usually you are questioned by how the system did run but didn't perform expected task.
In Rider editor attaching always work. I don't know what is the problem with VSCode but it just works in Rider. The attaching process is quite laggy, but as long as it works it pays off when you managed to find the bug.
Also with Burst off, the breakpoint even hit in the job code as well. I can hot swap Burst compilation while attaching and let the breakpoint work.
In VSCode, when trying to attach the editor usually even after I got it to attach and break properly :
- Doing something "too outrageous" would make the editor attaching lose its mood and stop breaking at all breakpoints.
- Sometimes it freezes Unity and need to restart both VSCode and Unity altogether. I find it often happen if attempt to attach while in play mode. (In Rider, I could attach/detach at any moment.)
Tracepoints / Logpoints
There is this practice of spraying log messages and just let the code run through them in order go get a grip about the situation. It may sounds rough but many times it is better than breakpoints because you can observe "from the top" order, patterns, and their frequency that would ultimately leads you to the solution why the test is not what you expected.
You may spray Debug.Log all over and remove them, which works when compile speed is fast. But it is not so practical to probe different place rapidly. Also in ECS I can't use Debug.Log then forget to comment it out, since Burst will pick it up and complain. Start using breakpoints/logpoints is crucial to ECS development than ever.
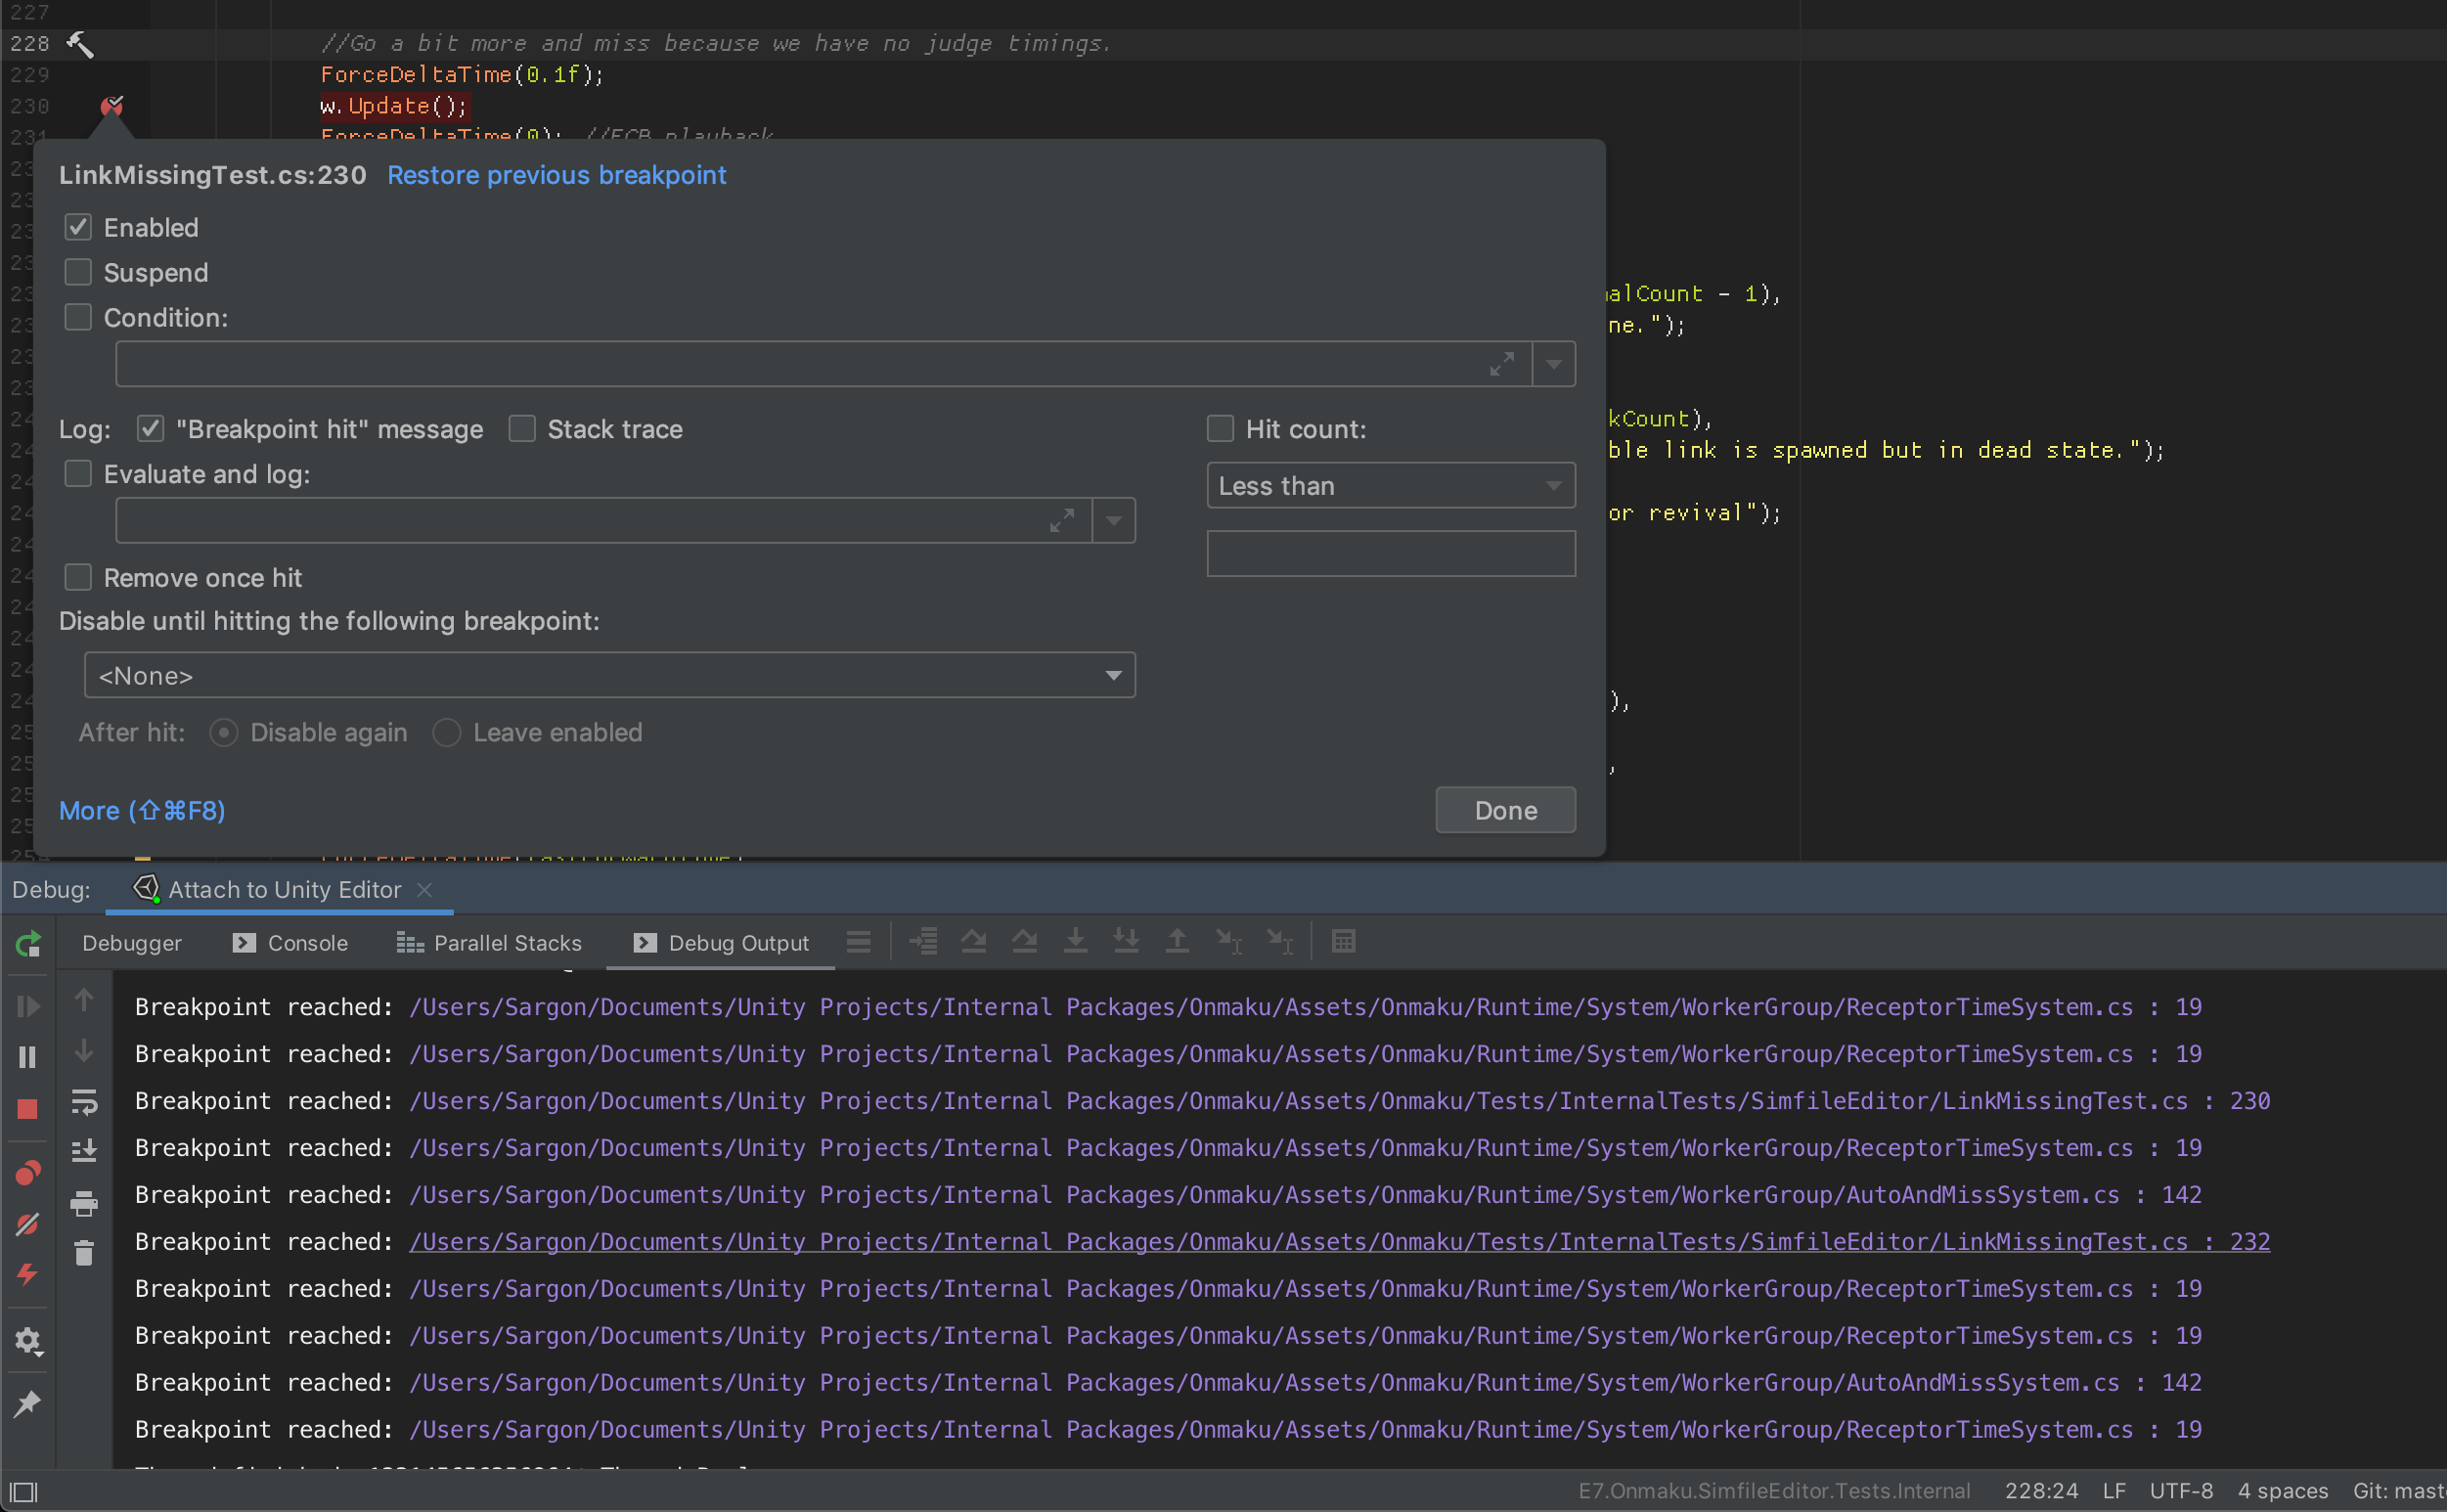
So let's use a proper function in the editor. VSCode has a Logpoint feature for this, and equally in Rider, you can turn off Suspend and then turn on Log : Breakpoint Hit message.
Rider wins because :
- The attach works 100% that would allow me to use the feature in the first place.
- You can log "nothing" when you don't know what to type, it will appear as a clickable link that jumps to that line of code. (As seen in the image, you can click any purple text besides "Breakpoint reached") This is very useful.
Run execution to here
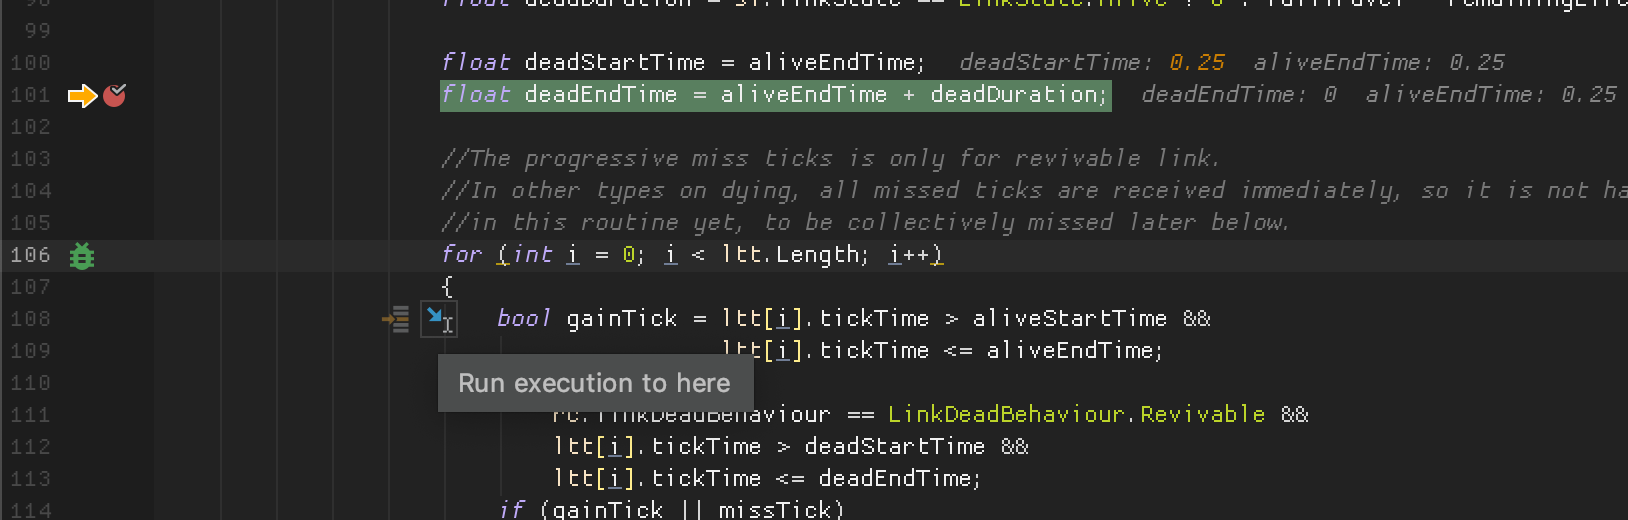
I think this is an another killer feature. Often the break point is not quite right. Repeatedly press step forward takes time. Placing a breakpoint far ahead and resume execution works, but I have to remove it immediately after because that's kinda temporary breakpoint. "Run execution to here" solve this problem more directly. And the button even appears on the line you clicked.
Fine tuning color theme
No theme is made just for you. While browsing themes you may find color palette you finally like. But maybe that red was too dark, maybe you like that green more flashy or more pastel. Maybe everything was perfect except they make method argument too colorful and it spread to an entire method since you use the argument everywhere.
In Rider, other Preferences maybe a bit bloated, but they have a very good theme editor where you could exactly pinpoint what would you like to change by clicking the displayed bits of sample text in the box below. Also it supports inheriting in an easy to understand way. The only improvement I want is that they could add an Apply button where I see my real code behind the dialog updates accordingly.
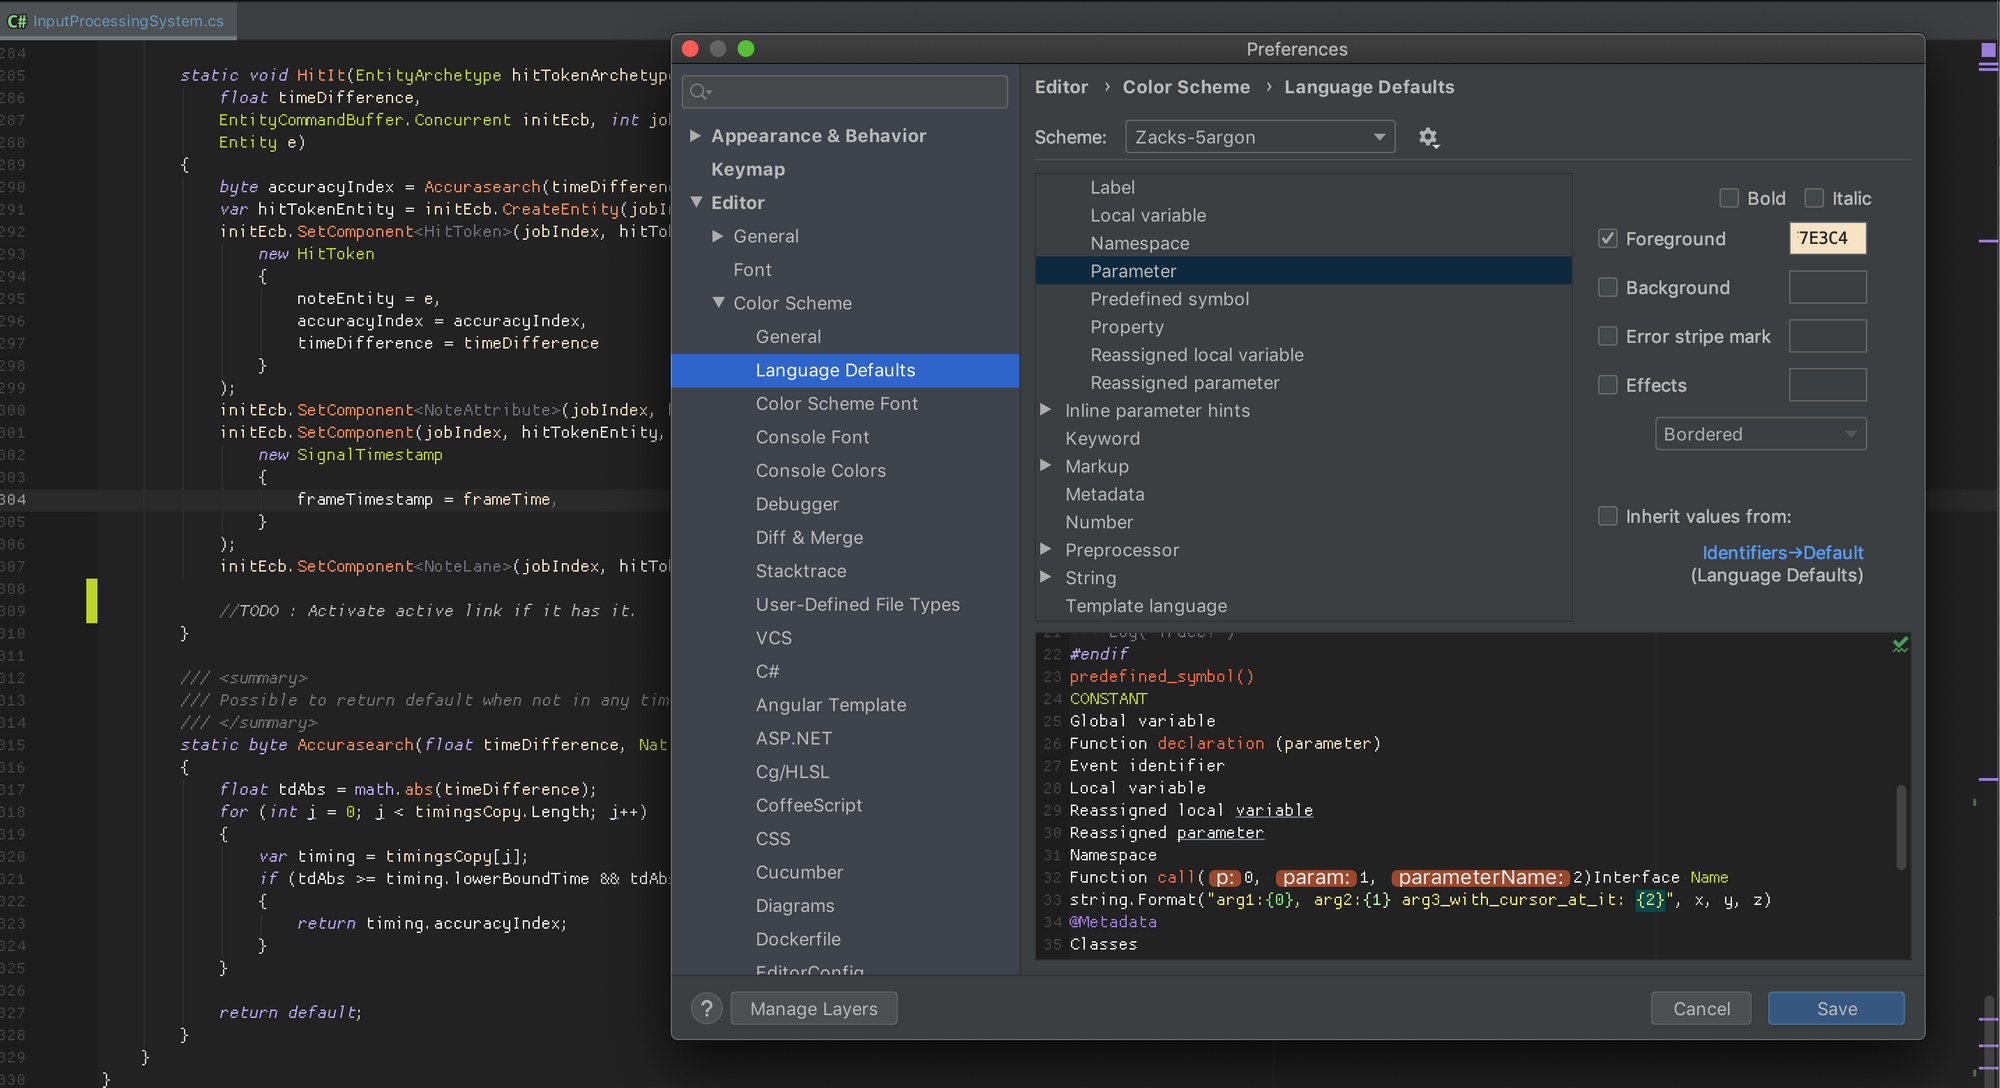
That was my adjustment to Rainglow's Zacks theme, which I like the color already except the red looks too much like error and purple requires too much attention to read so I made them lighter. Also the method argument was green, the same color as class name. Everything turned green in a method where I heavily use the passed in argument, and I don't like it. So I make the ( parameter ) you see above a cream color instead. It is close to white, but just enough so I could see what came from the top of method. Here's an original theme :
In VSCode, to further customize a theme further one need to debug TextMate scope.
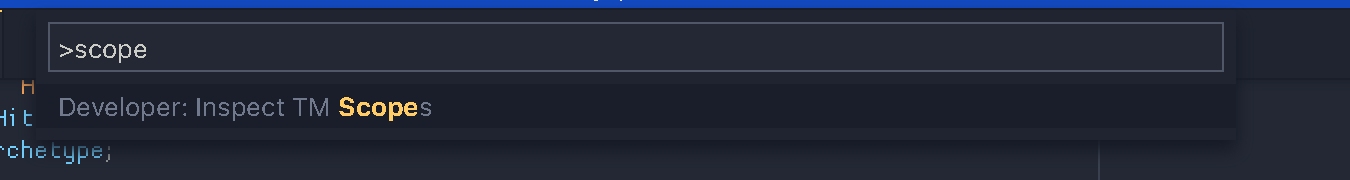
Then according to the returned score (like storage.type.cs here) you can override the color of the theme.
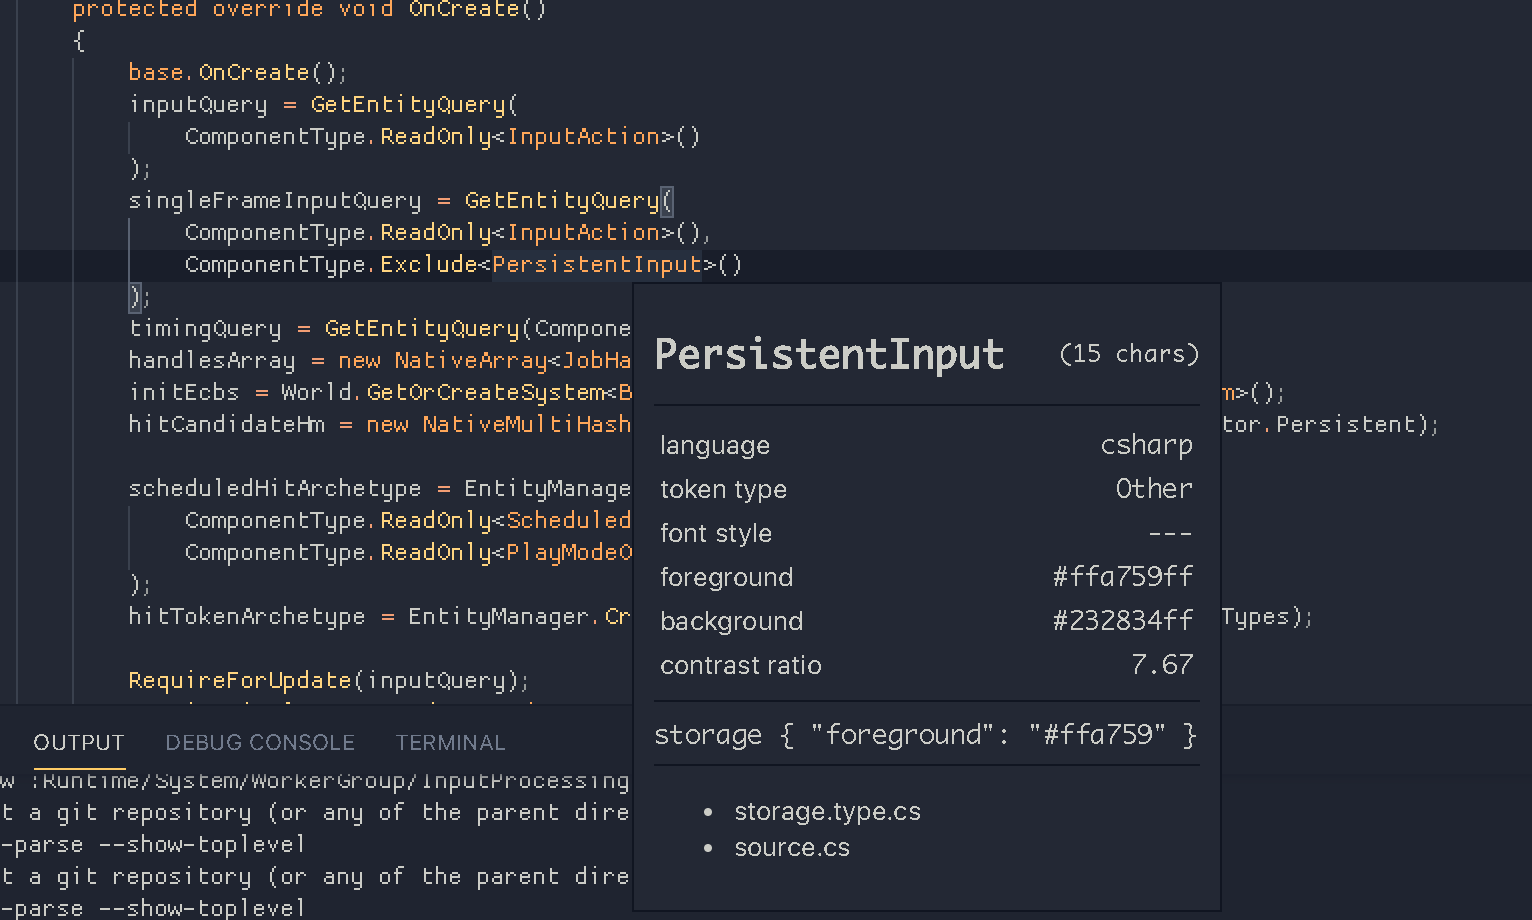
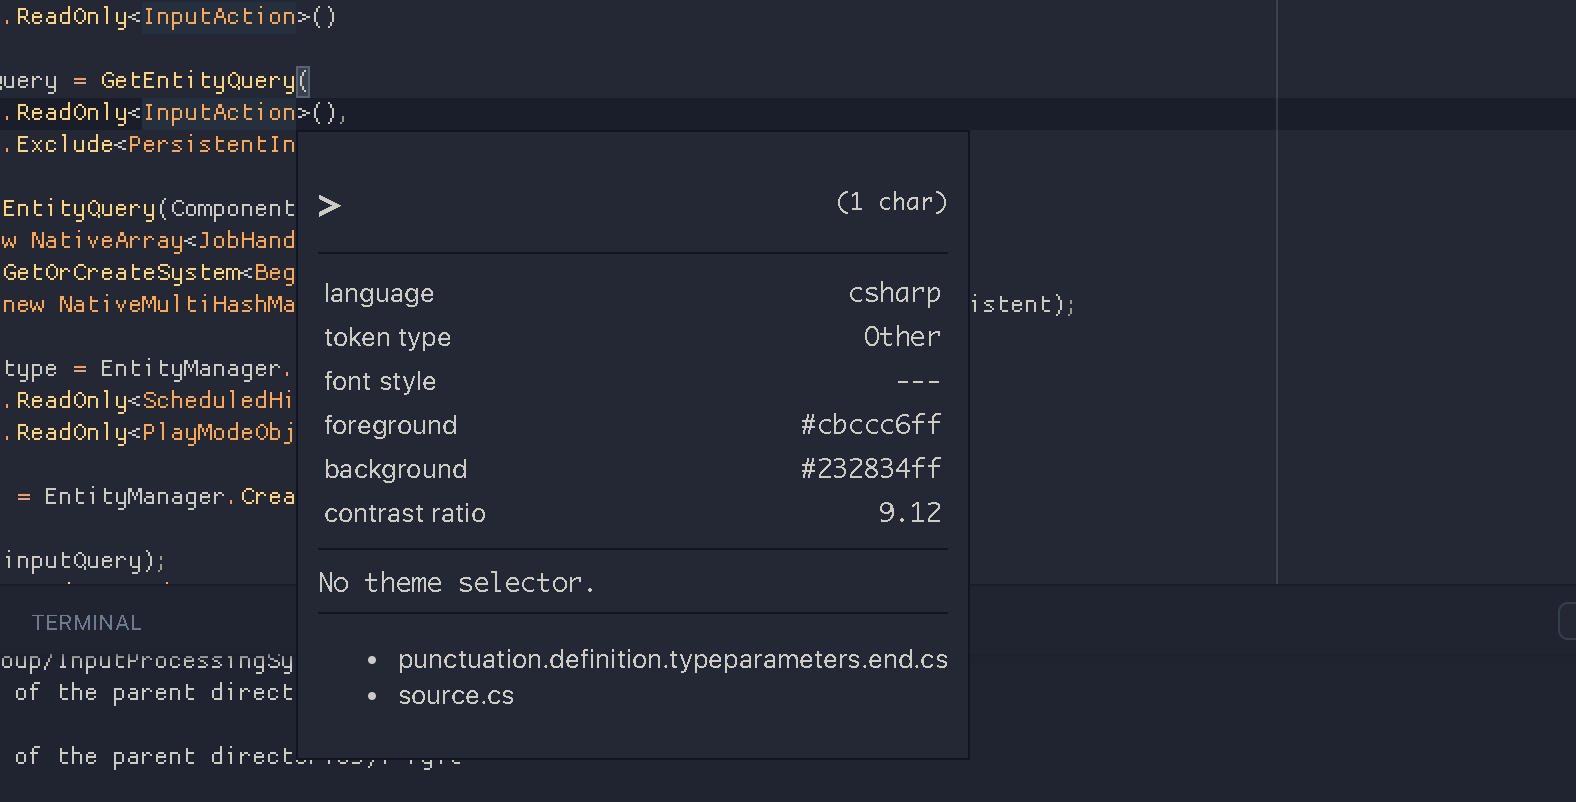
It is much more involving, but also it allows more fine grained adjustment. For example, it is impossible to color the < > in Rider. In Unity ECS, there are so many < > that I would like to make them a bit more stand out/more subdued. In VSCode, it has this puctuation.definition.typeparameters.end.cs that allow it to be themed.
Rearrange method signature
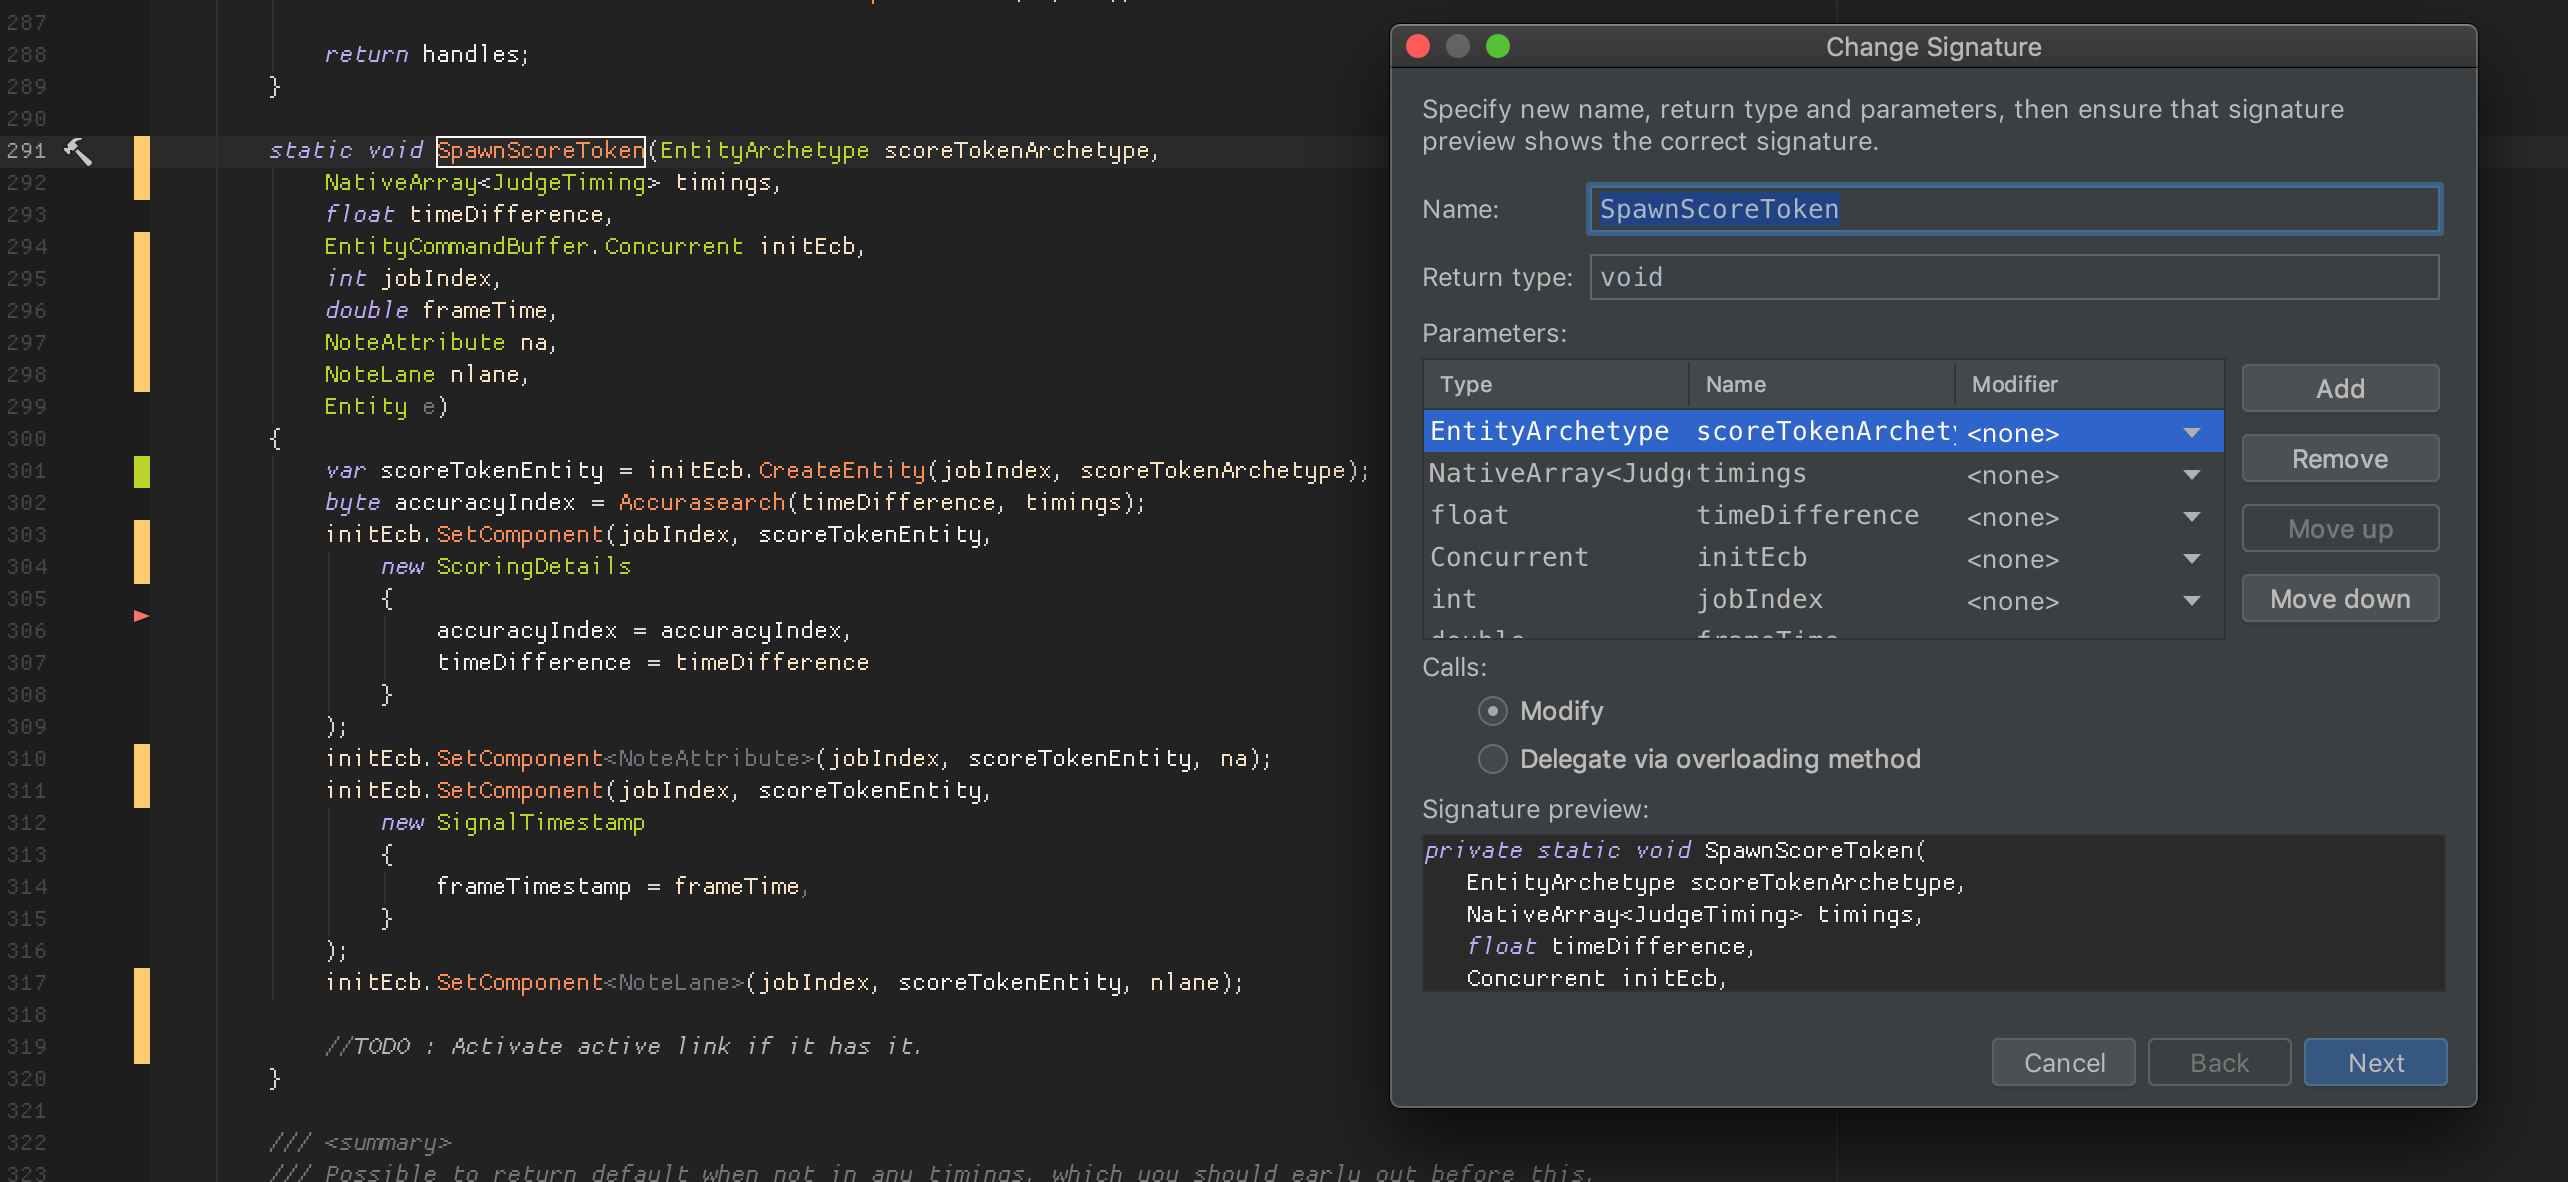
You can safely rearrange signature in a way that everything else updates accordingly.
You may think this is such an uncommon issue, but in Unity ECS, static method is going to be a very good way of sharing code between job functions which Burst could treat it as a part of code of each individul jobs. Previously we rely on OOP inheritance to reuse code.
This requires migrating a lot of things via argument so that static could work on what it was given. Able to rearrange them later let you just add required things without much thought at prototyping stage. (The user of the method would get updated arrangement as well, this is the biggest pain point on refactoring utility methods like this.)
Softwrap and line up-down
When situation calls for vertical split while programming, it is important to use softwrap (virutal line break) to be able to read code without scrolling. Vim commands Ctrl+w (window) then v (vertical) does this. Then you can switch between them with Ctrl+w Ctrl+w.
In VSCode, the soft wrapped line is not counted as a new line. So j k commands in Vim emulation will skip to the next real line.
In Rider, they are counted as a new line.
It depends, but I like the way it works in Rider. Anyways, commands like I will still go back to the real beginning of the real line. (What I wanted)
String split on enter
The above result was made by placing the caret on the middle of string and press enter. The + and all other " appears automatically. This is occasionally neat when you want some wild single line string to be more readable in code. (Unity's [Tooltip] comes to mind.)
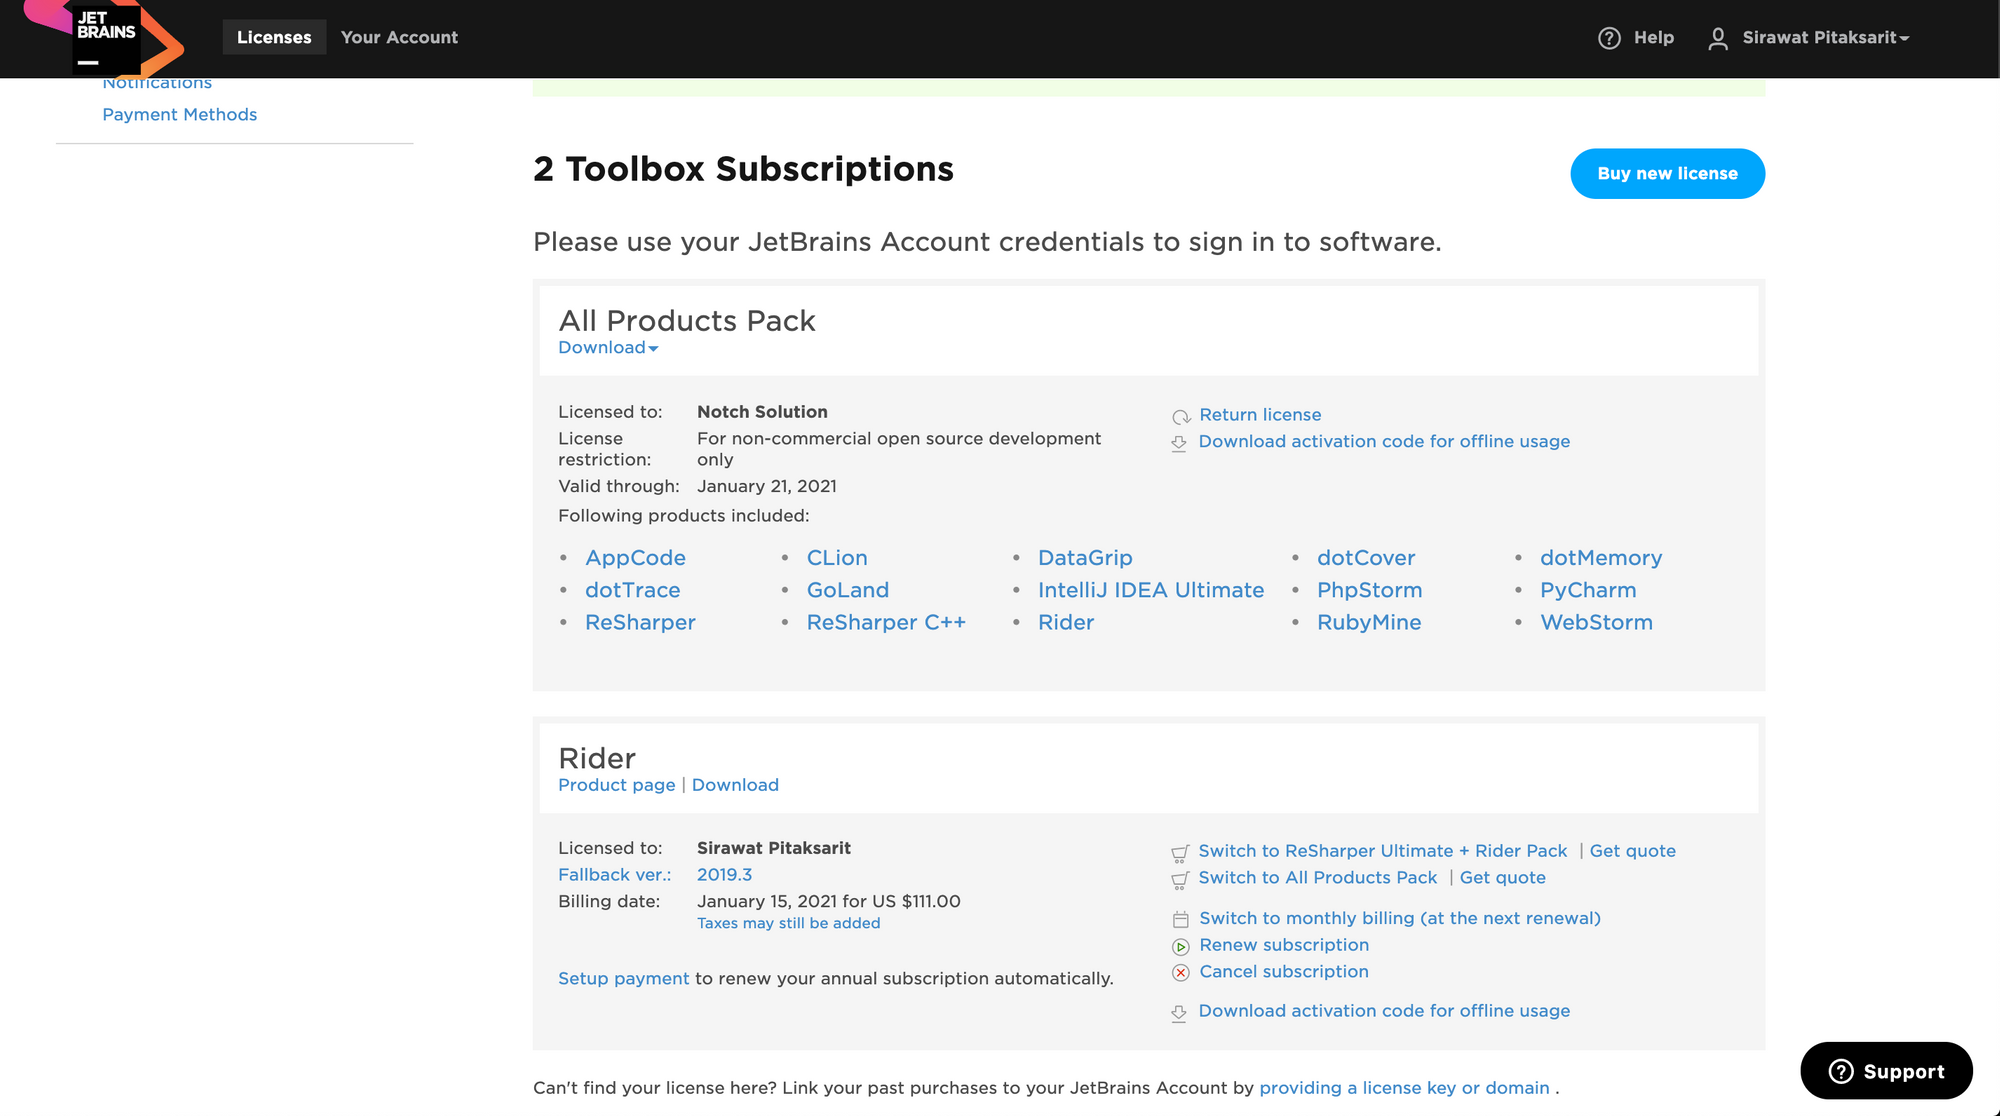
Open source license
If you maintain an open source project (you could be already if you UPM your game and some of the package are generic enough) you can apply for ALL product open source license. It could be only used for developing open source projects. But it allows you to use ALL tools. Maybe you can also branch out to non-C# open source projects too.
It lasts 1 year, which you may apply again if the project is still eligible. As you see below, I get only Rider for normal projects, but I can use everything for my open source projects now. Related to Rider, are dotMemory, dotCover and dotTrace. But I have no experience with them yet.
https://www.jetbrains.com/community/opensource/
Extract method
Not sure how the light bulb in VSCode could do because I had never use it, but in Rider it is really good.
I would't care much in OOP, but in data oriented design, we no longer wrap and reuse methods by means of inheritance anymore. (e.g. human has leg and could Walk and so do a dog that has leg, so you write the Walk code once. etc.)
And now one of very good way to reuse code is to just write a static function. Take something in and give out results, functional programming style. Burst code that touch these shared static code will then think that the code "belongs" to itself. (So you get duplicated assembly code in the burst compiled file, but shouldn't matter as long as performance is good.) The other way to share code is to bake some instance method in the struct that could help modify the struct itself.
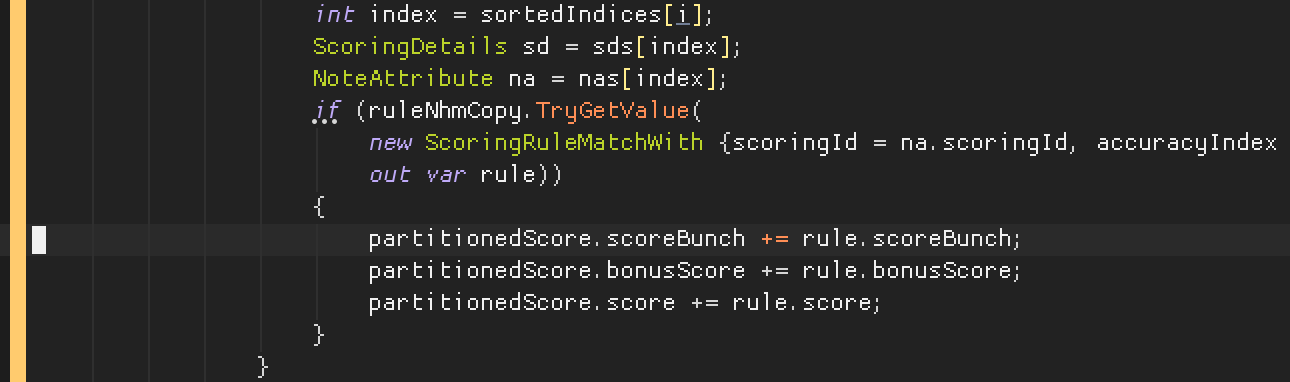
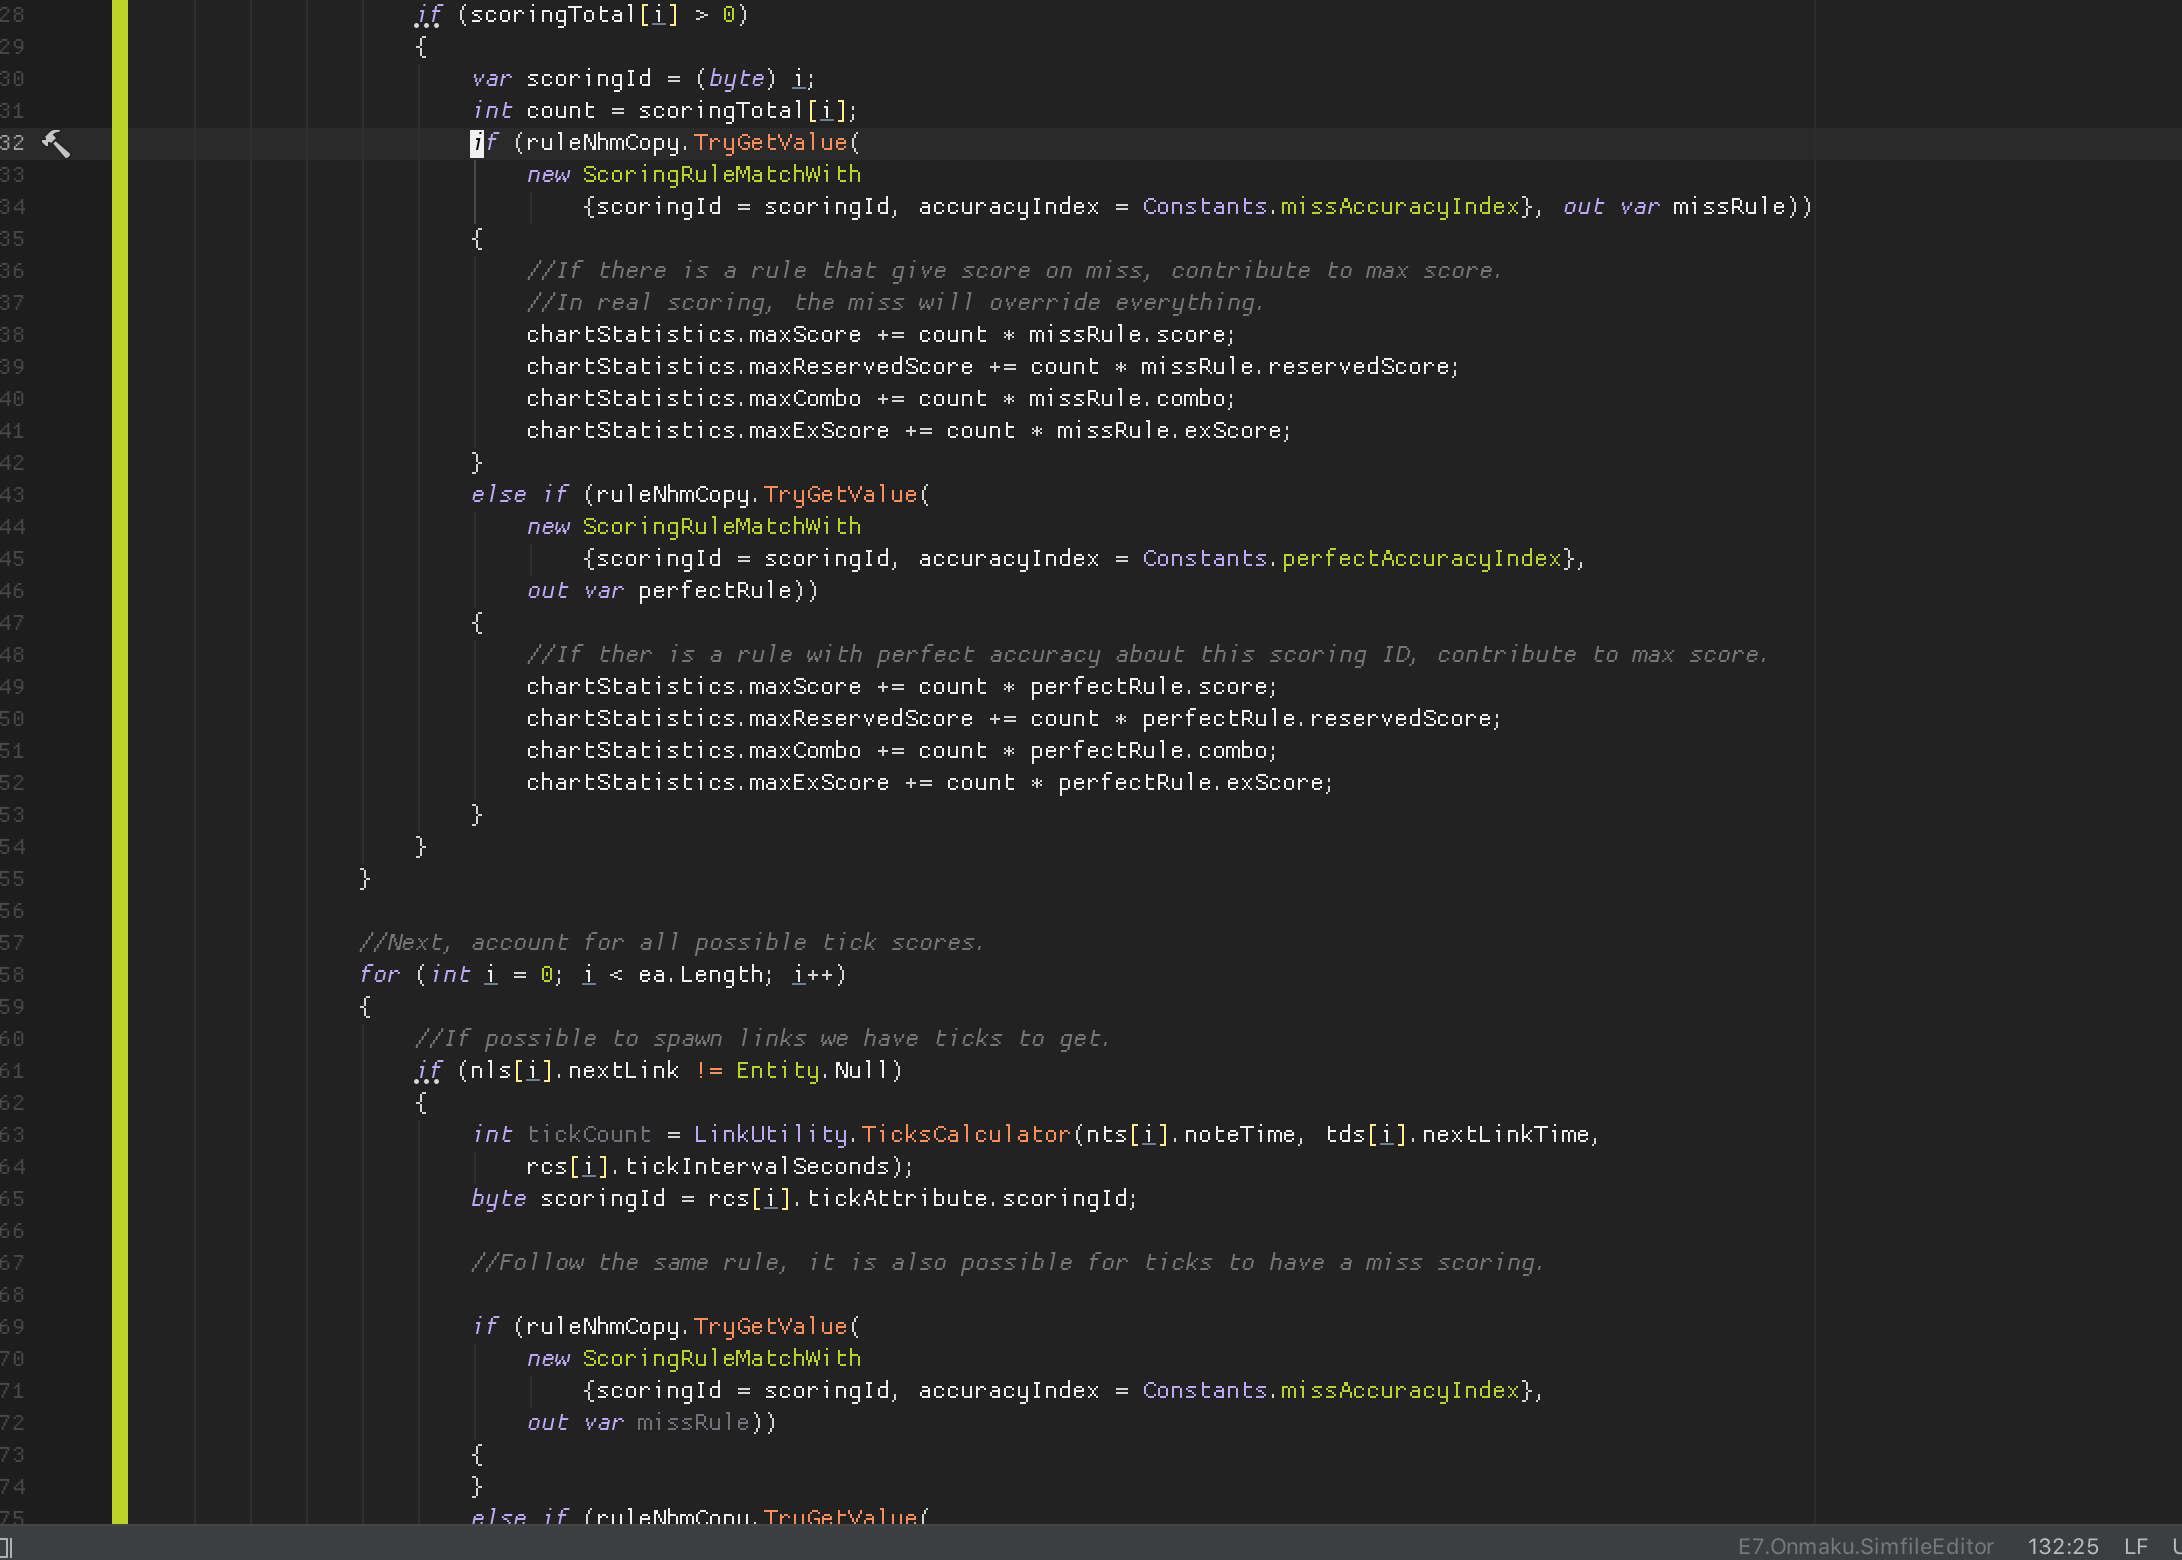
In this image below, it looks like the TryGetValue below is going according to the above ones. I noticed the pattern and therefore I would like to refactor out the above to also use on the one below.
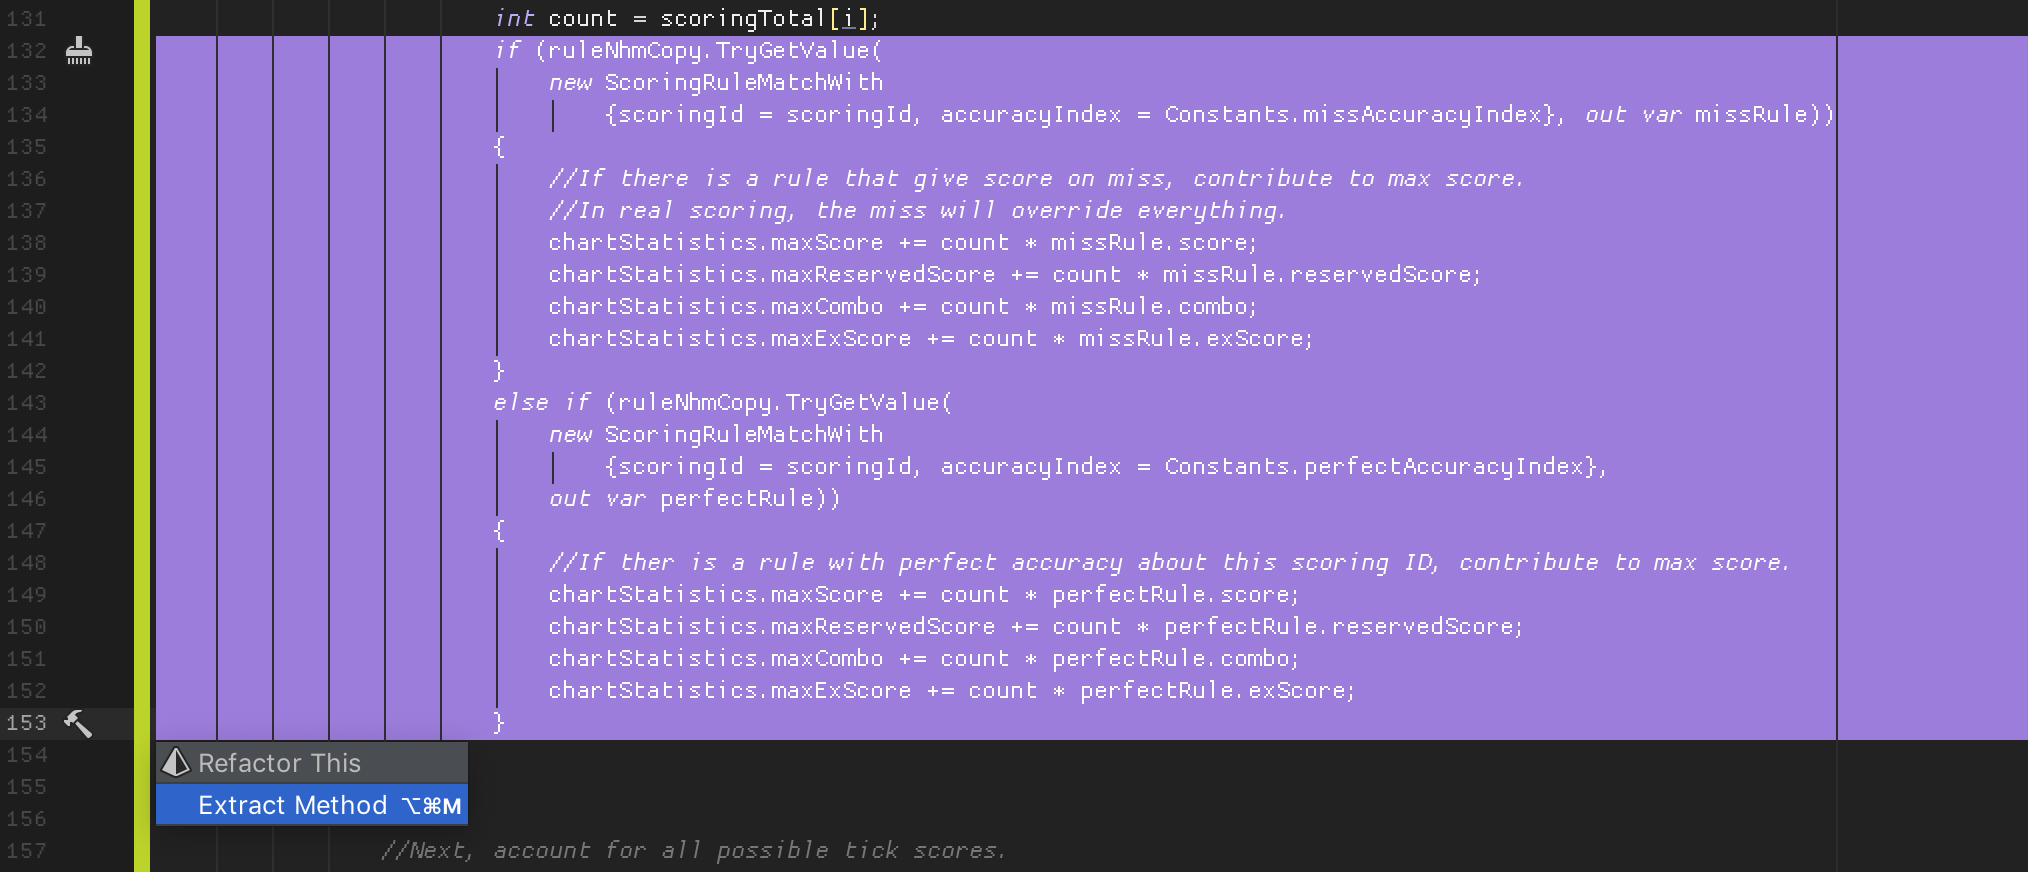
Refactoring out works on what you highlighted precisely. The following popup then let you customize whether you want return value, or you want ref style. It seems to know what I would like to get from the highlighted code. I was amazed.
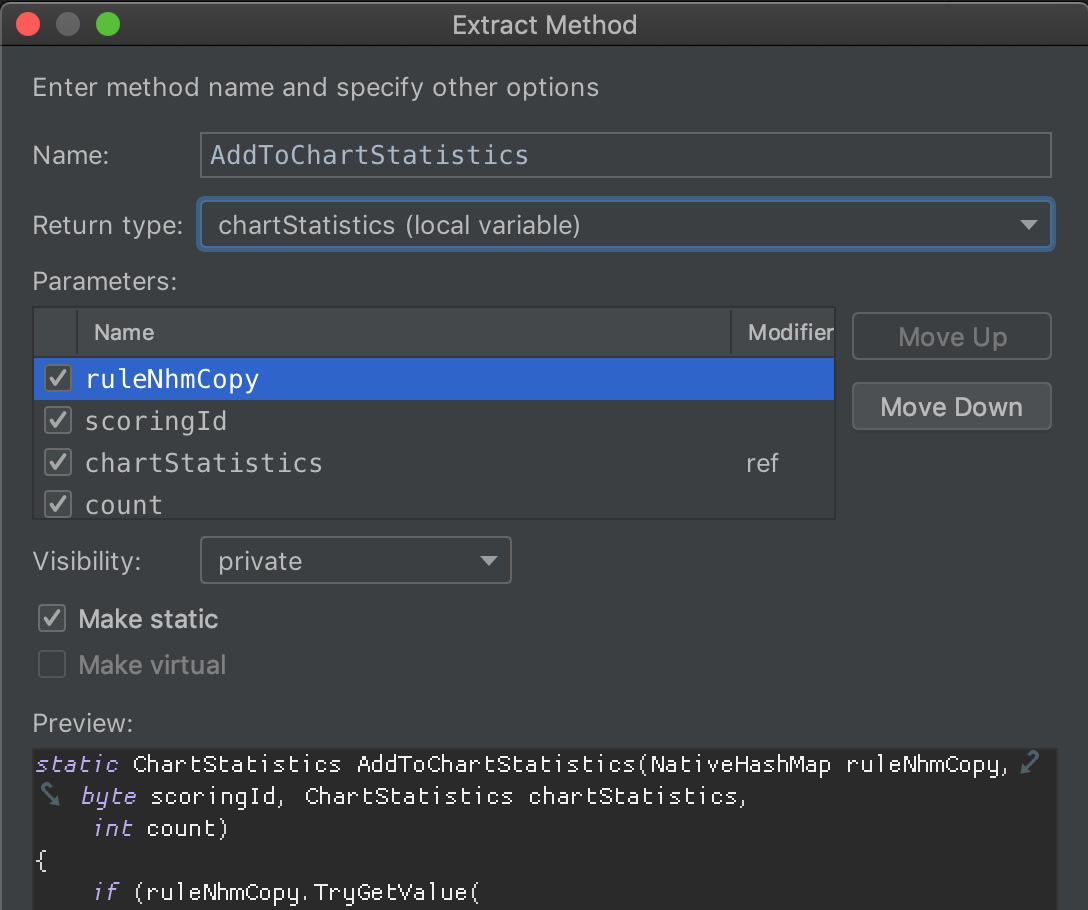
This is the FP style that take values in and return the changed value.
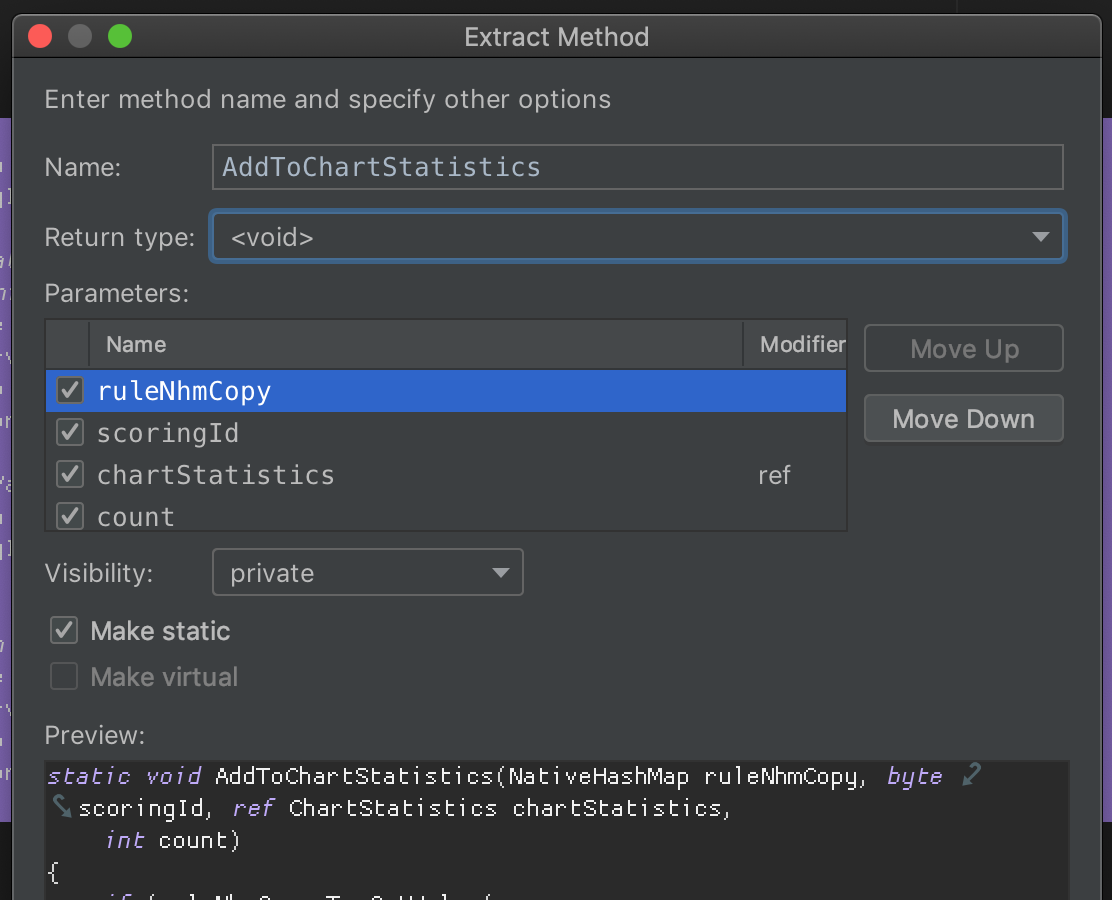
As you see when I prefer void as return type, then the generated method has to use ref for the value that connects with what's outside of my highlighed code.
Extract local function
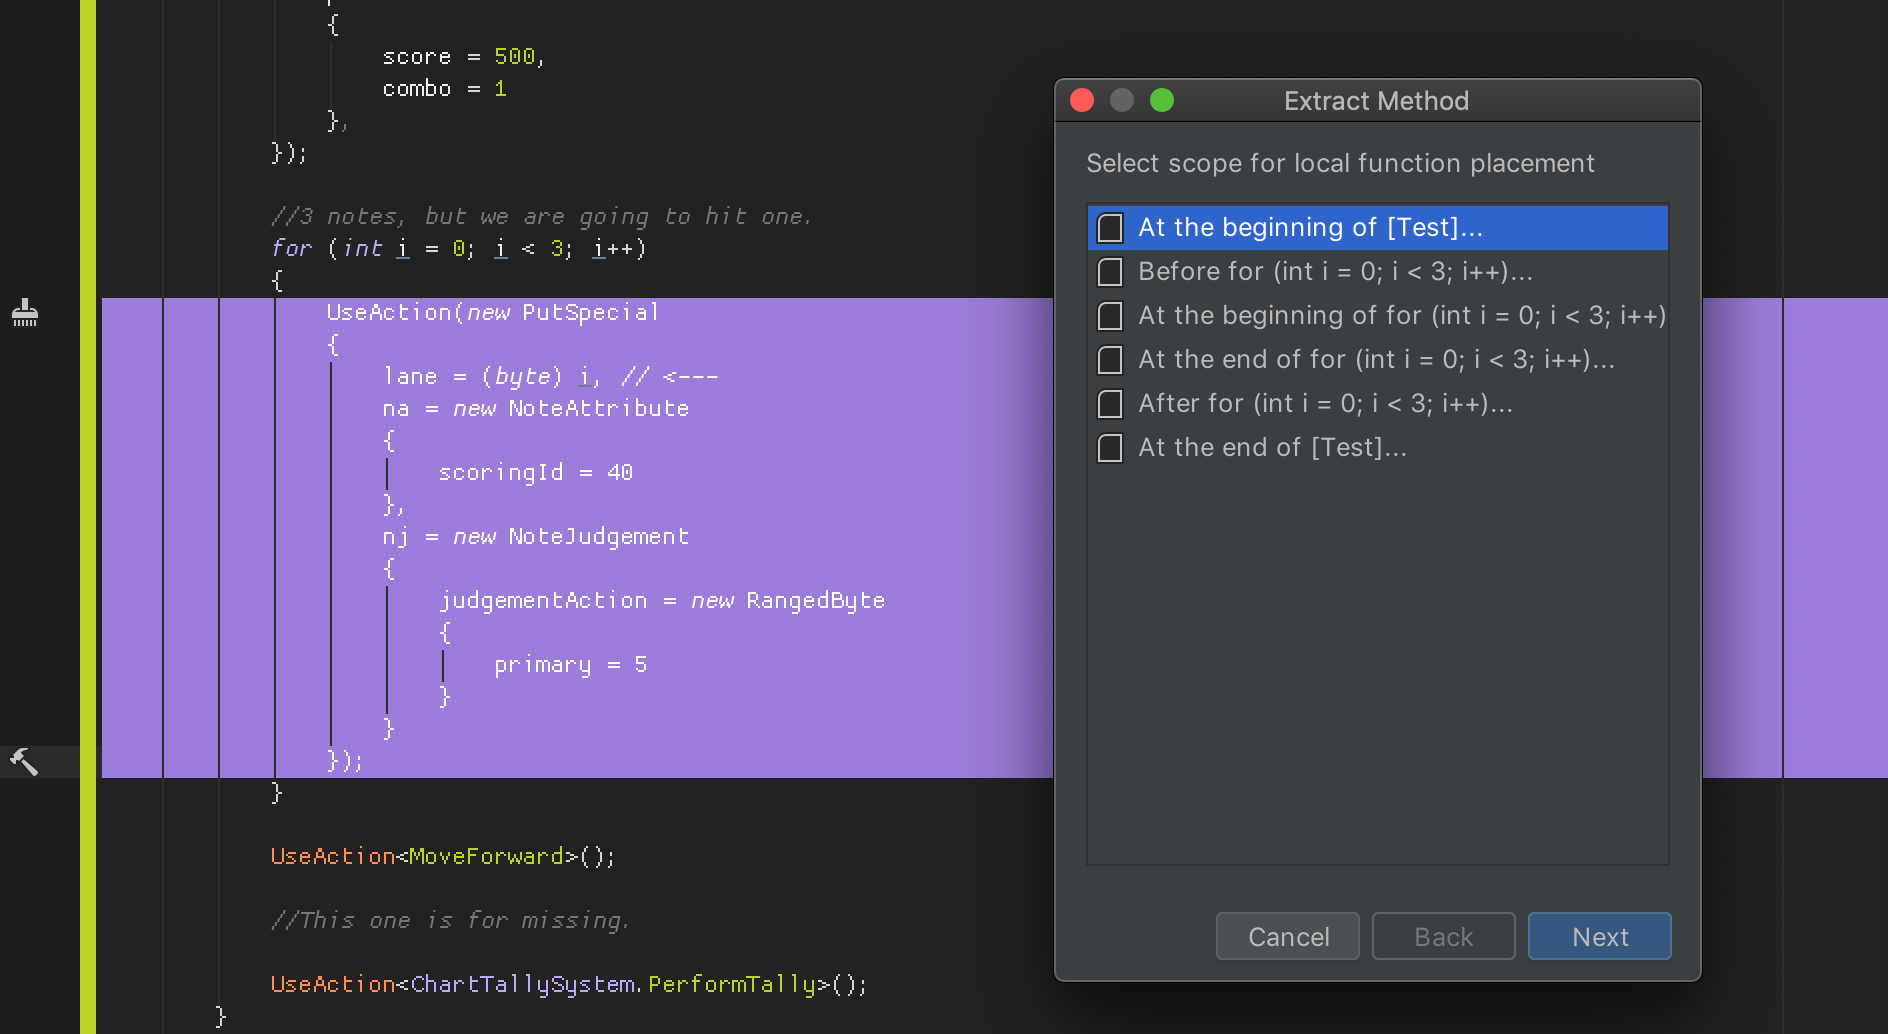
C# has added ability to nest a local function (no even private accessor, it's private in scope and has its own capture rule kinda like lambda). It is a bit weird to write and read and you sometimes don't know where to place them, but still interesting and I would like to practice using it more to create a more "functional" function. A method that contains little pieces of logic assembled.
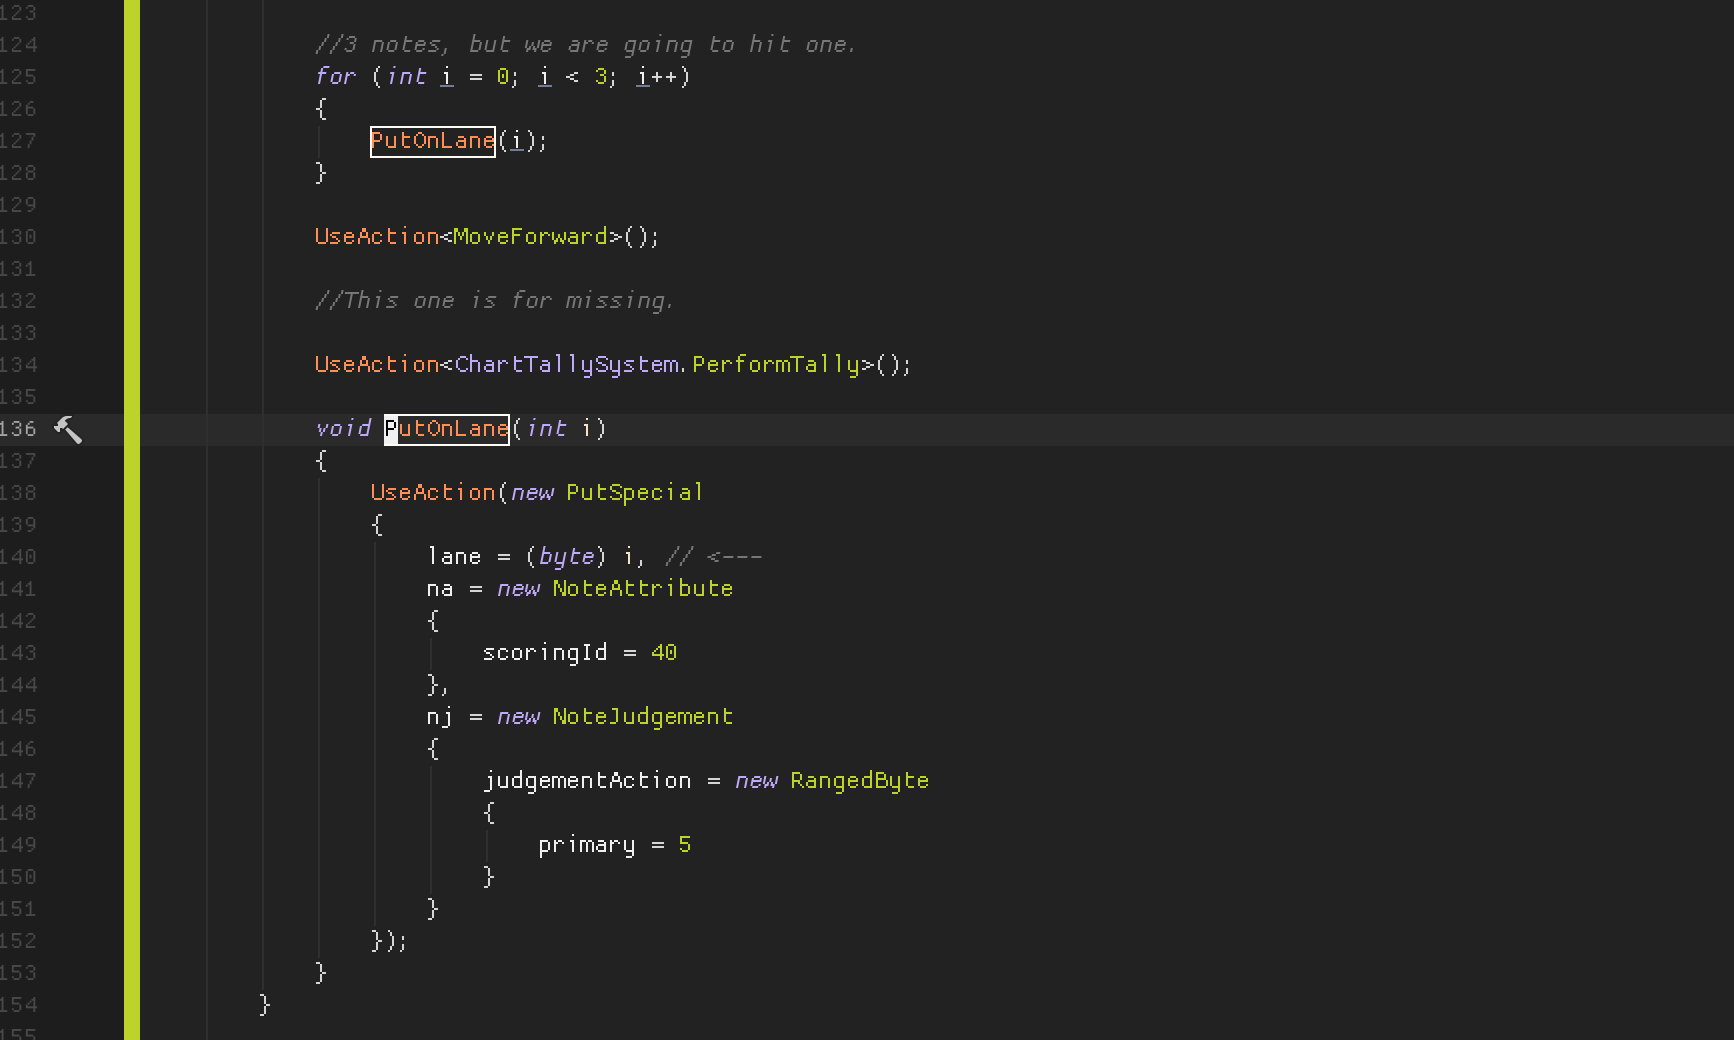
So, you can highlight and extrace a local function too, not just to the outer method. There is a dialog that ask you where, as local function could be anywhere.
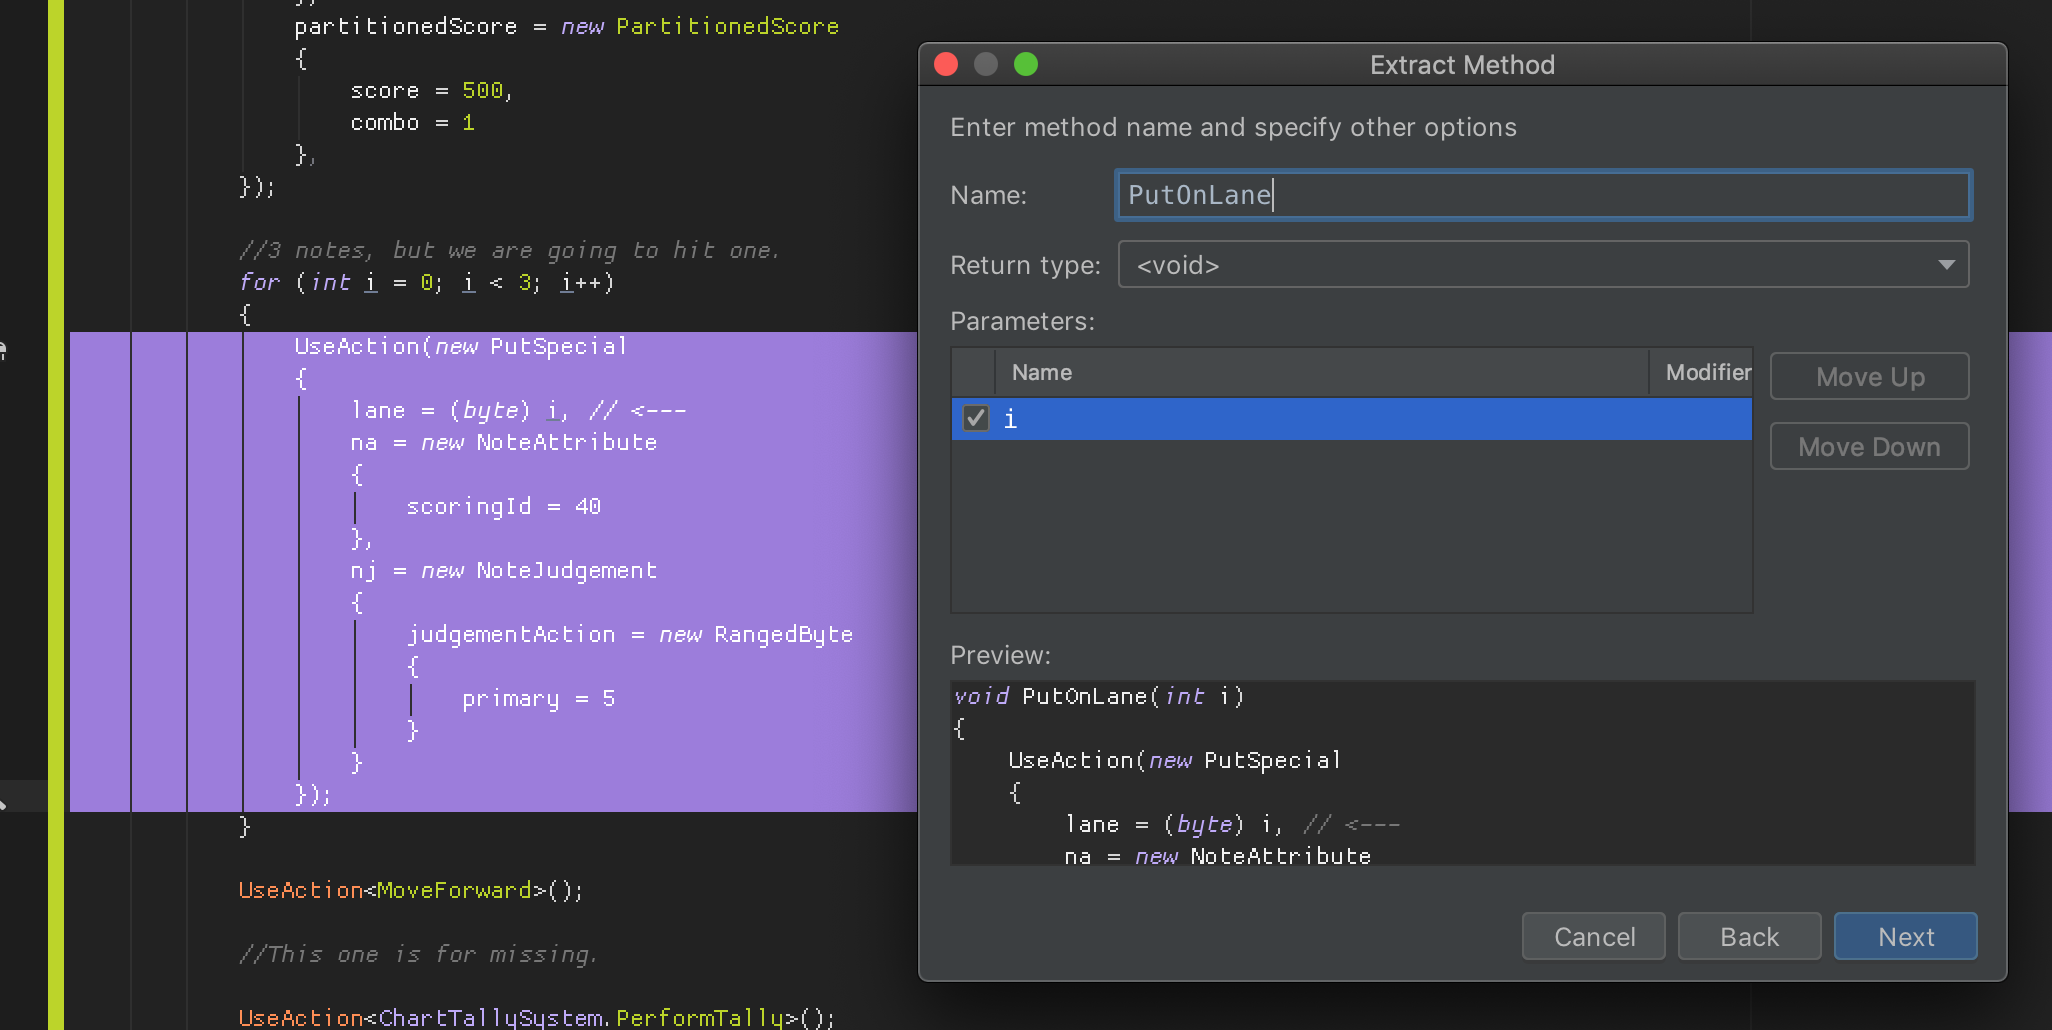
After that dialog, it knows which thing is external to the one you highlight and offer to turn that into a passed-in variable instead of a capture. This is very good to rapidly make a "pure" function out of your code draft. I am always in for things that could raise skill ceiling in programming and this encourages it.
This is also useful for writing tests, as in test you often explicitly perform some sequences before the check. Then you want to do that sequence again to test repeatability, etc. A local function is the most logical way to do it since it does not make sense that other tests could also use this sequence specific for this test.
Final verdict
I used Rider until the last minute, and went back to VSCode for 2-3 days just to make sure how I feel about Rider.
Despite the general impression that Rider is slower, I ended up purchasing 1 year license of it. Here's top things that made me make this decision :
- Editor attaching and breakpoint hitting that always work. This is very crucial in ECS unit testing.
- Finally some new skill ceiling to improve debugging skills because the attach always work. Especially, stop the
Debug.Logspraying habit and use logpoints. I would gladly pay so I have something new to level up. (This is exactly how seasonal pass monetization in games works...) - The editor is resistant to all refactor actions be it from quick fixes popup or by you dragging things in Explorer.
- It let me develop in packages with less friction.
- IdeaVim is generally faster and better, especially how it could come back to the same place after
gdinto it. - Go to definition knows how to drill into UPM package source code and not
dllversion of them. - No more annoying Omnisharp red squiggles. (And Resharper start up faster than Omnisharp)
I missed these in VSCode :
- More muted color design overall.
- Better Preferences that looked much less bloated.
- Lower battery drain when I am not plugged in.